Progress
Overview
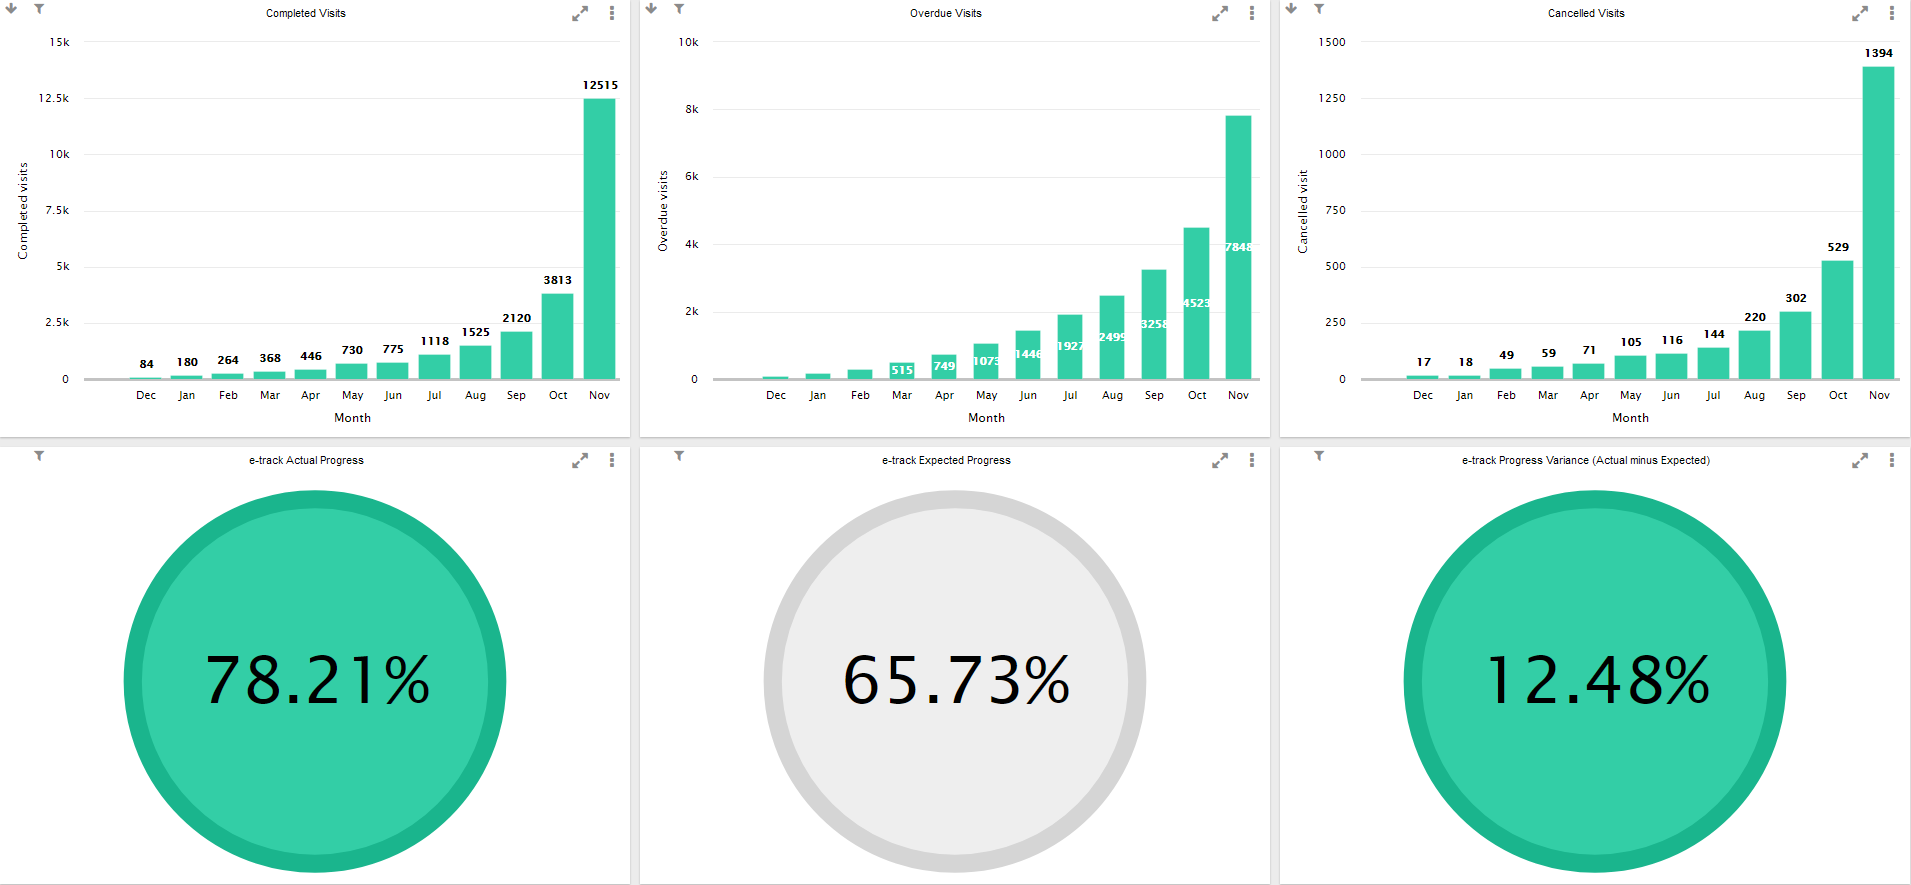
The Progress dashboard shows a summary of visits and Maytas Hub progress.
Cancelled Visits Config
A configuration option is available which lets you specify the visit outcomes to be used for cancelled visits on this dashboard. To set this in Maytas:
- Click the M5 button at the top-left and select Options.
- Scroll down to the Others section on the left and select BI.
- Tick the box next to the config Visit outcome lookups to use for cancelled visits.
- Enter the lookup short string values for the visit outcomes you want to use for cancelled visits on the dashboard, separating each value with a comma (e.g. a,b,c).
- Click OK.
Charts
Completed Visits
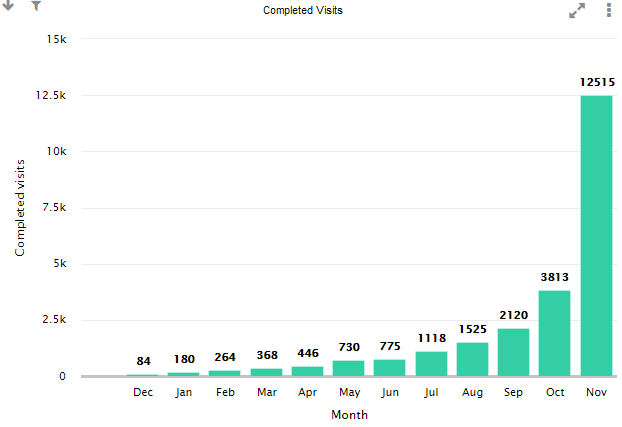
Shows the number of visits completed each month, based on the visit actual date. This chart does not include visits with an outcome specified in the cancelled visits config.
Overdue Visits
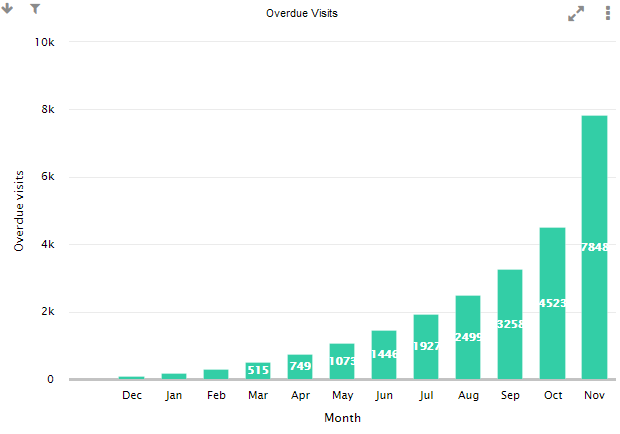
Shows the ongoing number of overdue visits in each month, where the visit actual date is either not entered or is after the planned date.
For example, if a visit is planned for March but actually takes place in May, the visit would be counted as overdue in March, April and May.
A visit will still be counted as overdue if the planned and actual dates are in the same month and the actual date is later than the planned date.
This chart does not include visits with an outcome specified in the cancelled visits config.
Cancelled Visits
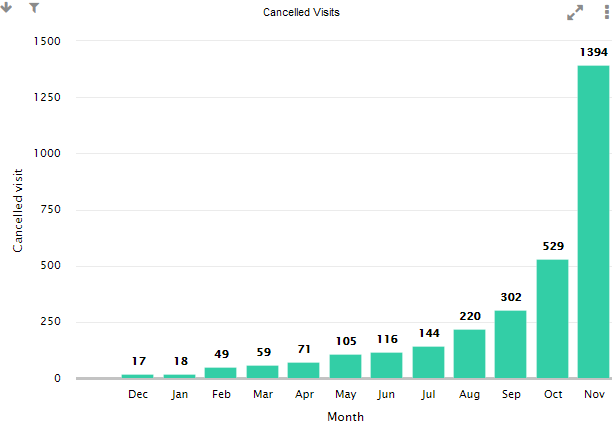
Shows the number of visits that were cancelled each month, based on the month of the visit planned date and a visit outcome specified in the cancelled visits config.
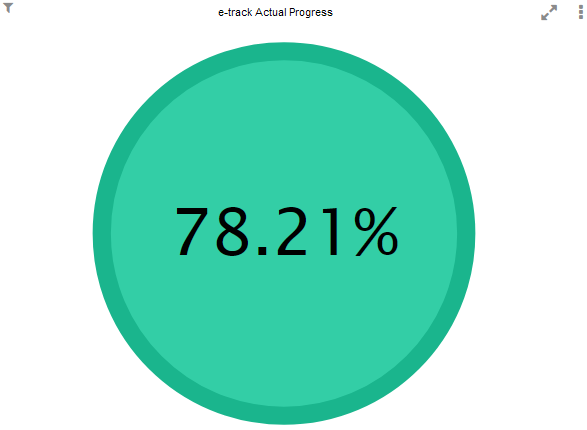
Maytas Hub Actual Progress
Shows the average Maytas Hub progress for all current learners. This uses data calculated by the Maytas Hub Stats Service (TRFRAMEWORK.TOTALPROGRESS), where the total progress is less than 100%. The calculation is:
Sum of total progress less than 100%
/
Number of learners with total progress less than 100%.
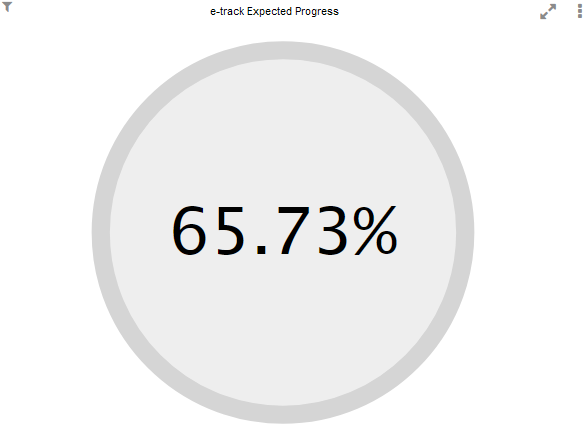
Maytas Hub Expected Progress
Shows the average expected Maytas Hub progress for all current learners. This uses data calculated by the Maytas Hub Stats Service (TRFRAMEWORK.EXPECTEDPROGRESS), where the total progress is less than 100%. The calculation is:
Sum of expected progress less than 100%
/
Number of learners with total progress less than 100%.
This will display as red for 0 to 33%, amber for 33 to 66% and green for 66 to 100%.
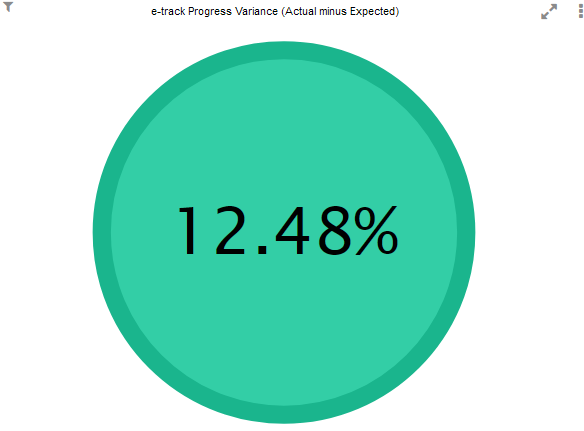
Maytas Hub Progress Variance (Actual minus Expected)
Shows the difference between the actual progress and the expected progress.
This will display as green for a positive value (i.e. where actual progress equals or exceeds expected progress) and red for a negative value.
