Finance
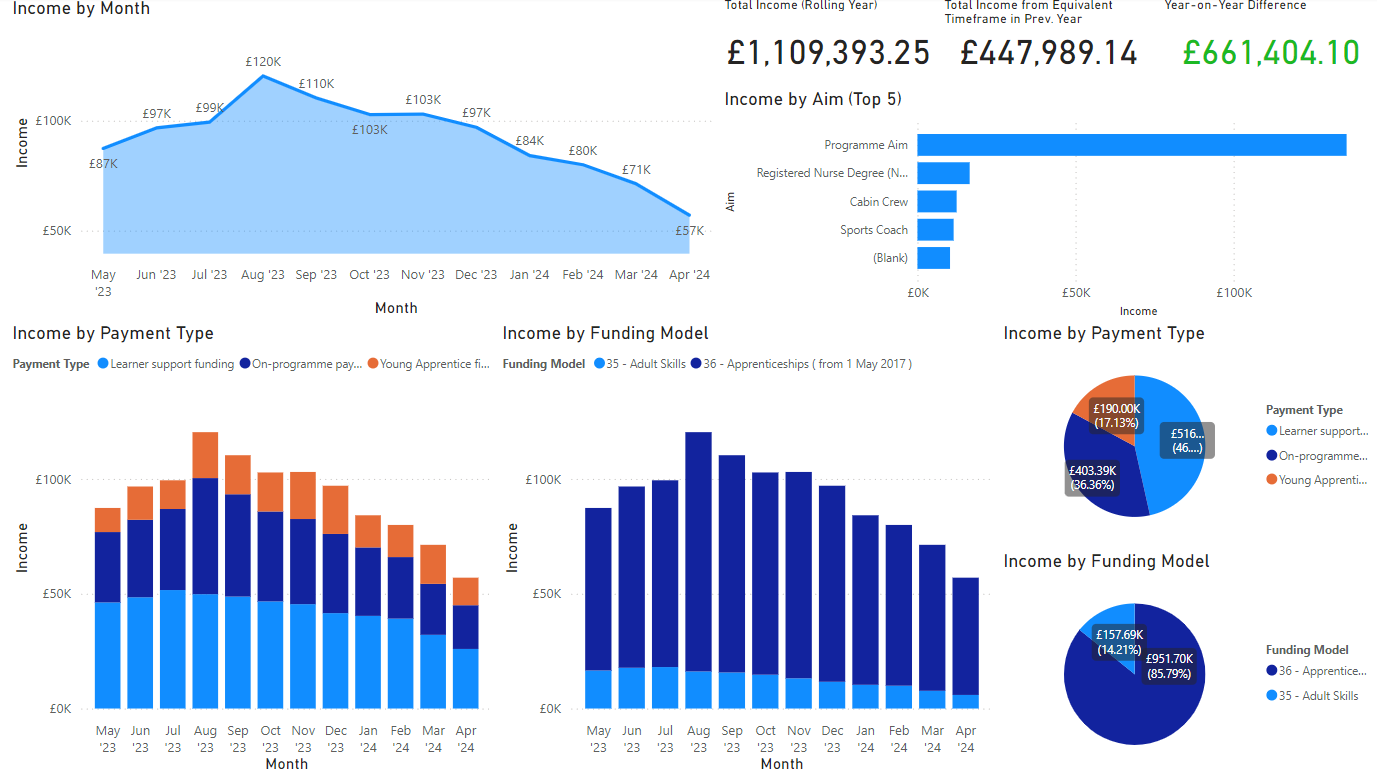
The Finance dashboard shows a summary of financial figures and trends.
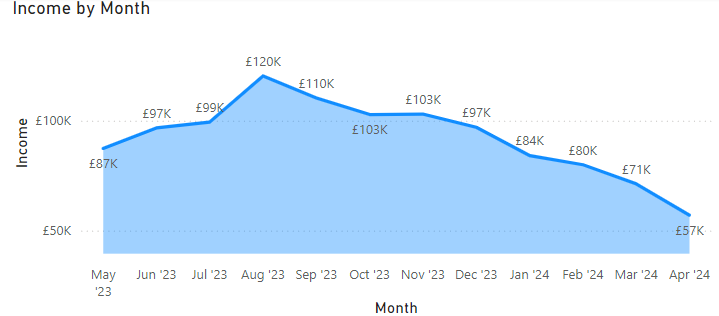
Income by Month
Shows the total income each month over the past rolling 12 months.
The 12 month timeframe is defined as the last full 12 months - i.e. not including the current month. For example, if the current month was June 2024, the timeframe would cover 1st June 2023 to 31st May 2024.
Total Income (Rolling Year)
Shows the total income from the past rolling 12 months.

Total Income from Equivalent Timeframe in Prev. Year
Shows the total income from 13 to 24 months ago.

Year-on-Year Difference
Shows the total income from the past 12 months minus the total income from 13 to 24 months ago. If the difference is positive it will show as green, whereas if the difference is negative then it will show as red.

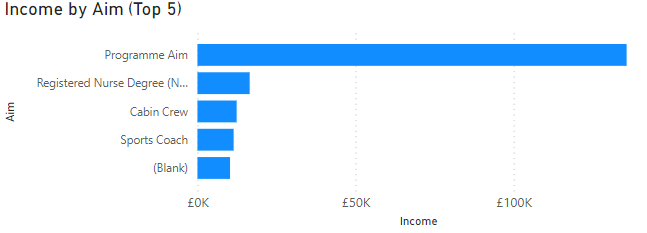
Income by Aim (Top 5)
Shows the income for the 5 aims with the highest income over the past 12 months.
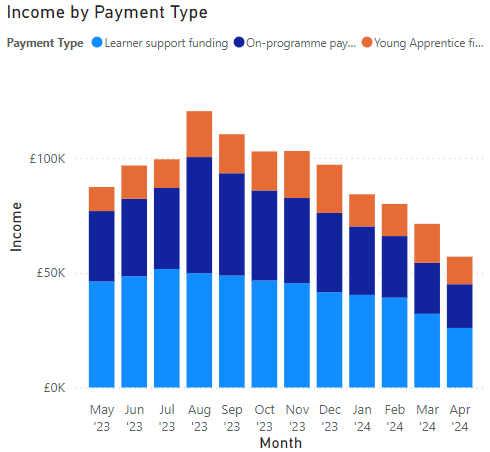
Income by Payment Type
Shows the income each month broken down by the payment type.
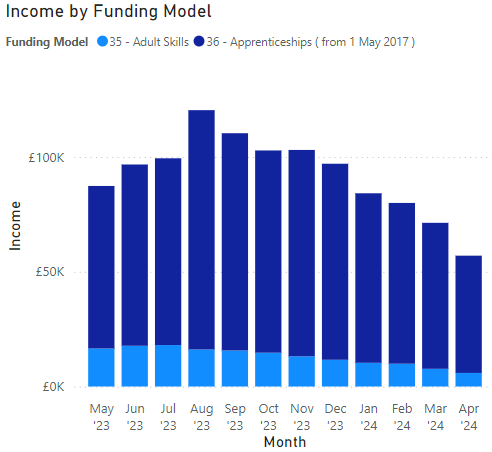
Income by Funding Model
Shows the income each month broken down by the funding model.
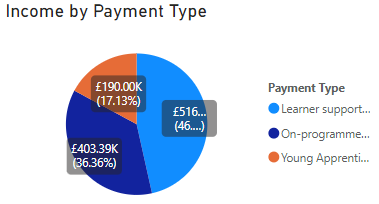
Income by Payment Type (pie chart)
Shows the total income over the past 12 months broken down by the payment type.
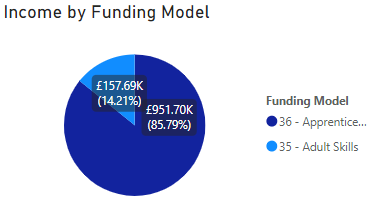
Income by Funding Model (pie chart)
Shows the total income over the past 12 months broken down by the funding model.
