In Learning
The In Learning dashboard shows a variety of data relating to learners currently in learning.
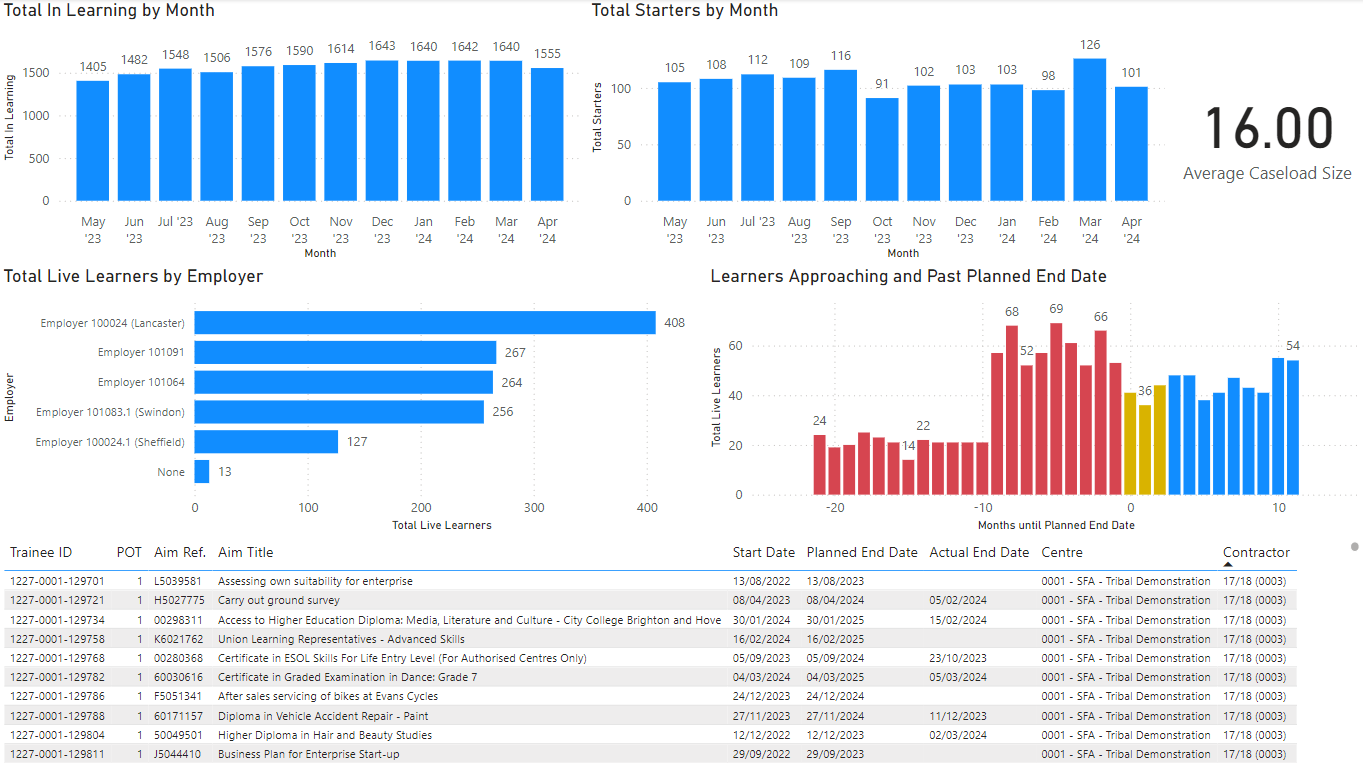
Total in Learning by Month
Shows the total number of learners who were in learning each month over the past rolling 12 months. To be counted in a month, a learner must have been in learning for at least one day during the month, based on the POT start date and termination date.
The 12 month timeframe is defined as the last full 12 months - i.e. not including the current month. For example, if the current month was June 2024, the timeframe would cover 1st June 2023 to 31st May 2024.
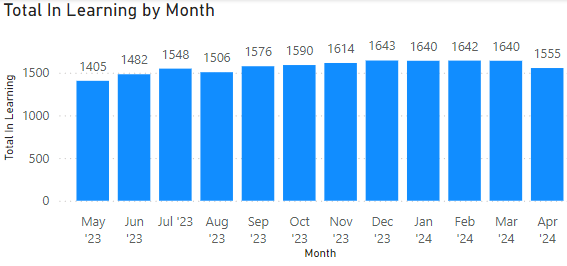
Total Starters by Month
Shows the total number of learners who started learning each month over the past 12 months. This is based on the POT start date.
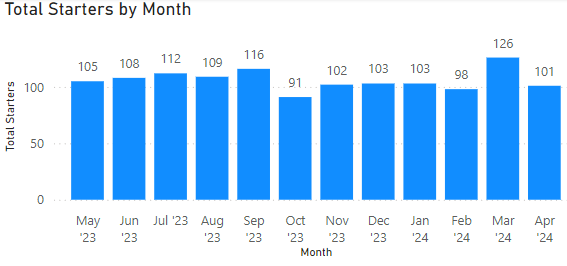
Average Caseload Size
Shows the average caseload size for assessors based on data from the past 12 months.
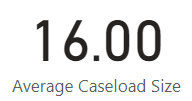
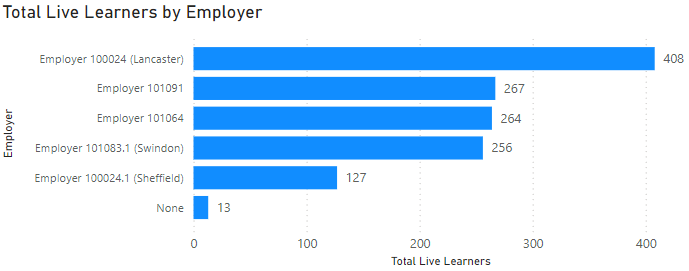
Total Live Learners by Employer
Shows the number of learners currently in learning, grouped by employer.
Learners Approaching and Past Planned End Date
Shows the number of learners currently in learning and how many months away their planned end date is, or how many months they are past their planned end date. This is based on the main aim planned end date for ILR learners and the LP77 Expected Programme End Date for LLWR learners.
-
The red area shows learners who are past their planned end date
-
The yellow area shows learners whose planned end date is in the current month or in the next two months.
-
The blue area shows learners whose planned end date is 3 or more months away.

Details Table
Shows the breakdown of learners used on the dashboard. Clicking on a figure in one of the other charts will filter the table by the relevant learners.
