Progress
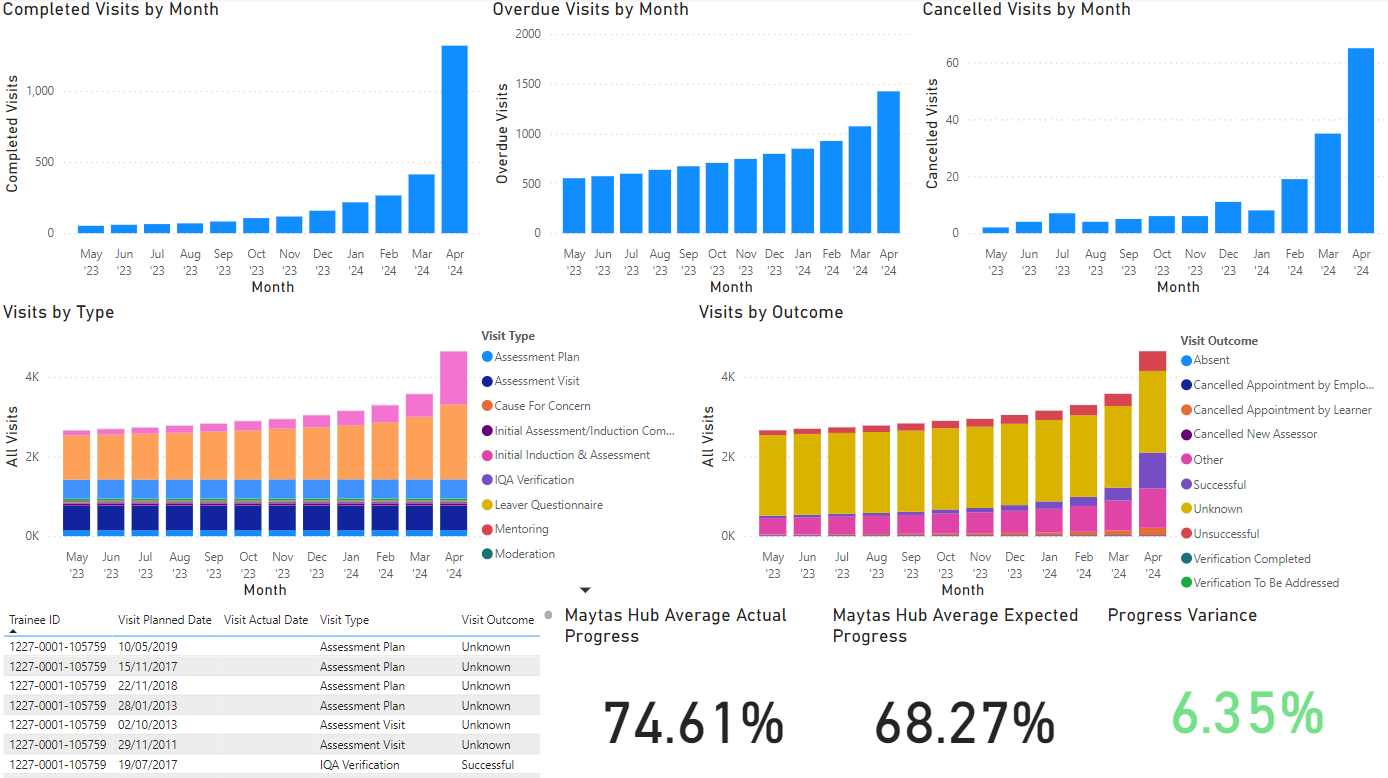
The Progress dashboard shows a summary of learner visits and Maytas Hub progress.
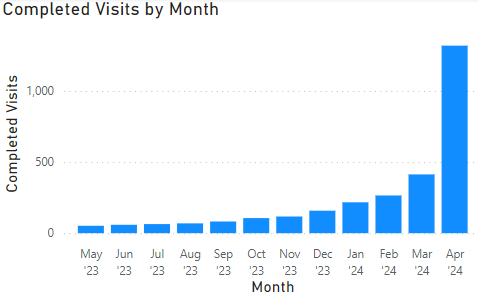
Completed Visits by Month
Shows the number of visits by the month of the actual date (not including cancelled visits).
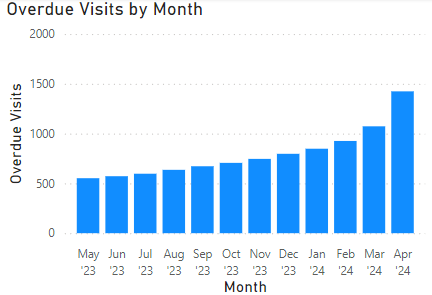
Overdue Visits by Month
Shows the number of visits each month (not including cancelled visits) where:
-
the planned date is in the past and the actual date has not been entered
OR
-
the planned date is in the past and the actual date was on a later day than the planned date
An overdue visit can be counted in multiple months. For example, if a visit has a planned date of 31st July and an actual date of 1st August, the visit would be counted as overdue in both July and August.
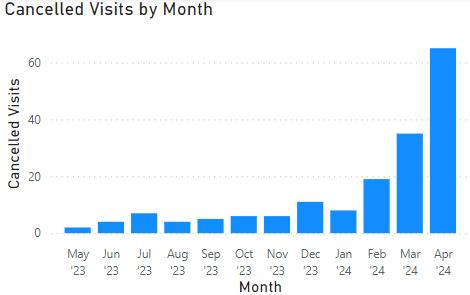
Cancelled Visits by Month
Shows the number of visits by the month of the actual date where the outcome indicates that the visit was cancelled.
The outcome types which indicate a cancelled visit can be specified via a configuration option:
-
In Maytas 5, click the M5 button at the top-left and select Options.
-
Select BI on the left (in the Others section).
-
Tick the checkbox for the Visit outcome lookups to use for cancelled visits option.
-
Enter the short string for each outcome lookup you wish to use for cancelled visits, separated by a comma (e.g. A,B,C).
-
Click OK.
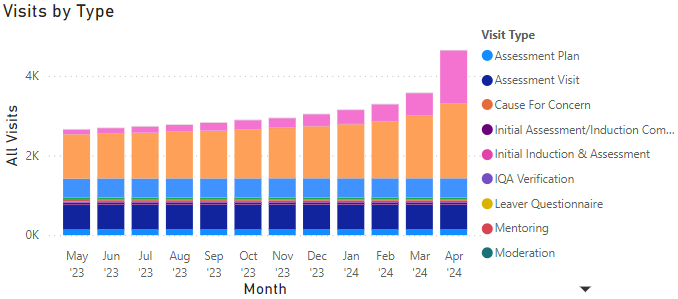
Visits by Type
Shows all learner visits that are relevant to a month - i.e. those where the planned date is in that month or an earlier month and where the actual end date (if entered) is in that month or a later month. The results are broken down by visit type.
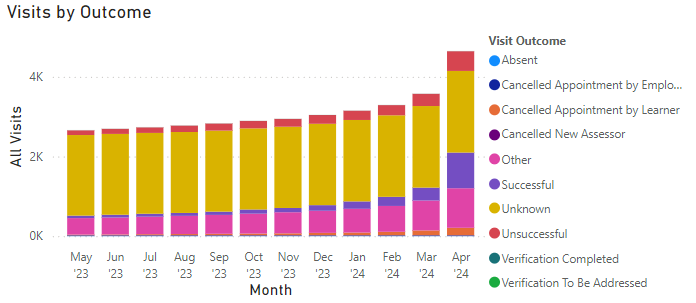
Visits by Outcome
Shows all learner visits that are relevant to a month - i.e. those where the planned date is in that month or an earlier month and where the actual end date (if entered) is in that month or a later month. The results are broken down by outcome.
Details Table
Shows the breakdown of learners and visits used on the dashboard. Clicking on a figure in one of the other charts will filter the table by the relevant learners and visits.

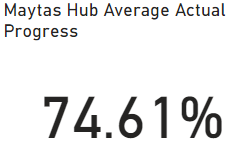
Maytas Hub Average Actual Progress
Shows the average actual progress for all current learners (i.e. learners whose total actual progress is less than 100 and the POT termination date is not entered). This uses data from the TRFRAMEWORK table, which is populated by the Stats Service.
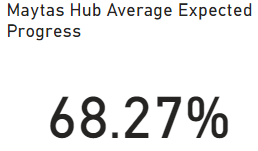
Maytas Hub Average Expected Progress
Shows the average expected progress for all current learners (i.e. learners whose total actual progress is less than 100 and the POT termination date is not entered). This uses data from the TRFRAMEWORK table, which is populated by the Stats Service.
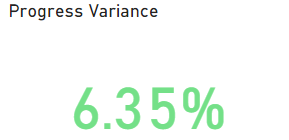
Progress Variance
Shows the average actual progress minus the average expected progress. If the result is positive, the figure is shown in green, whereas if the result is negative, the figure is shown in red.
