Tips and Miscellaneous Notes
Chart Tools
View Data Details
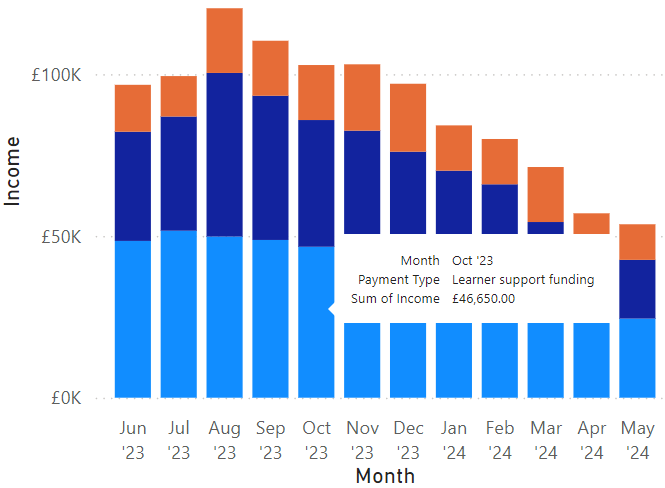
Hovering the cursor over data in a chart will display additional details relating to that data, including any groupings and the specific value for that data point.
Expand Charts
To expand a chart so that it uses the entire dashboard area:
-
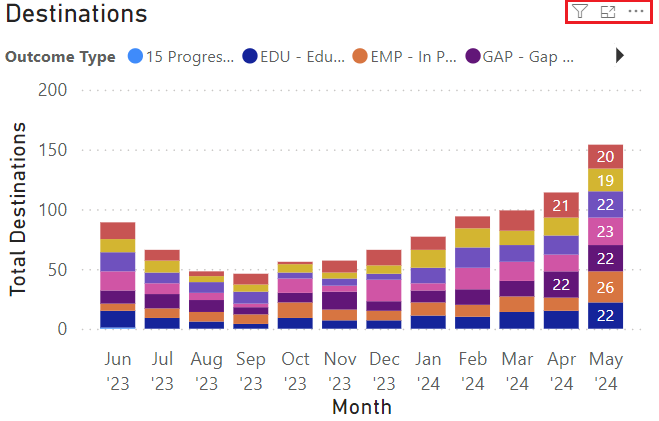
Move the cursor over the chart so the toolbar appears at the top-right.
-
Click the
 button to expand the chart.
-
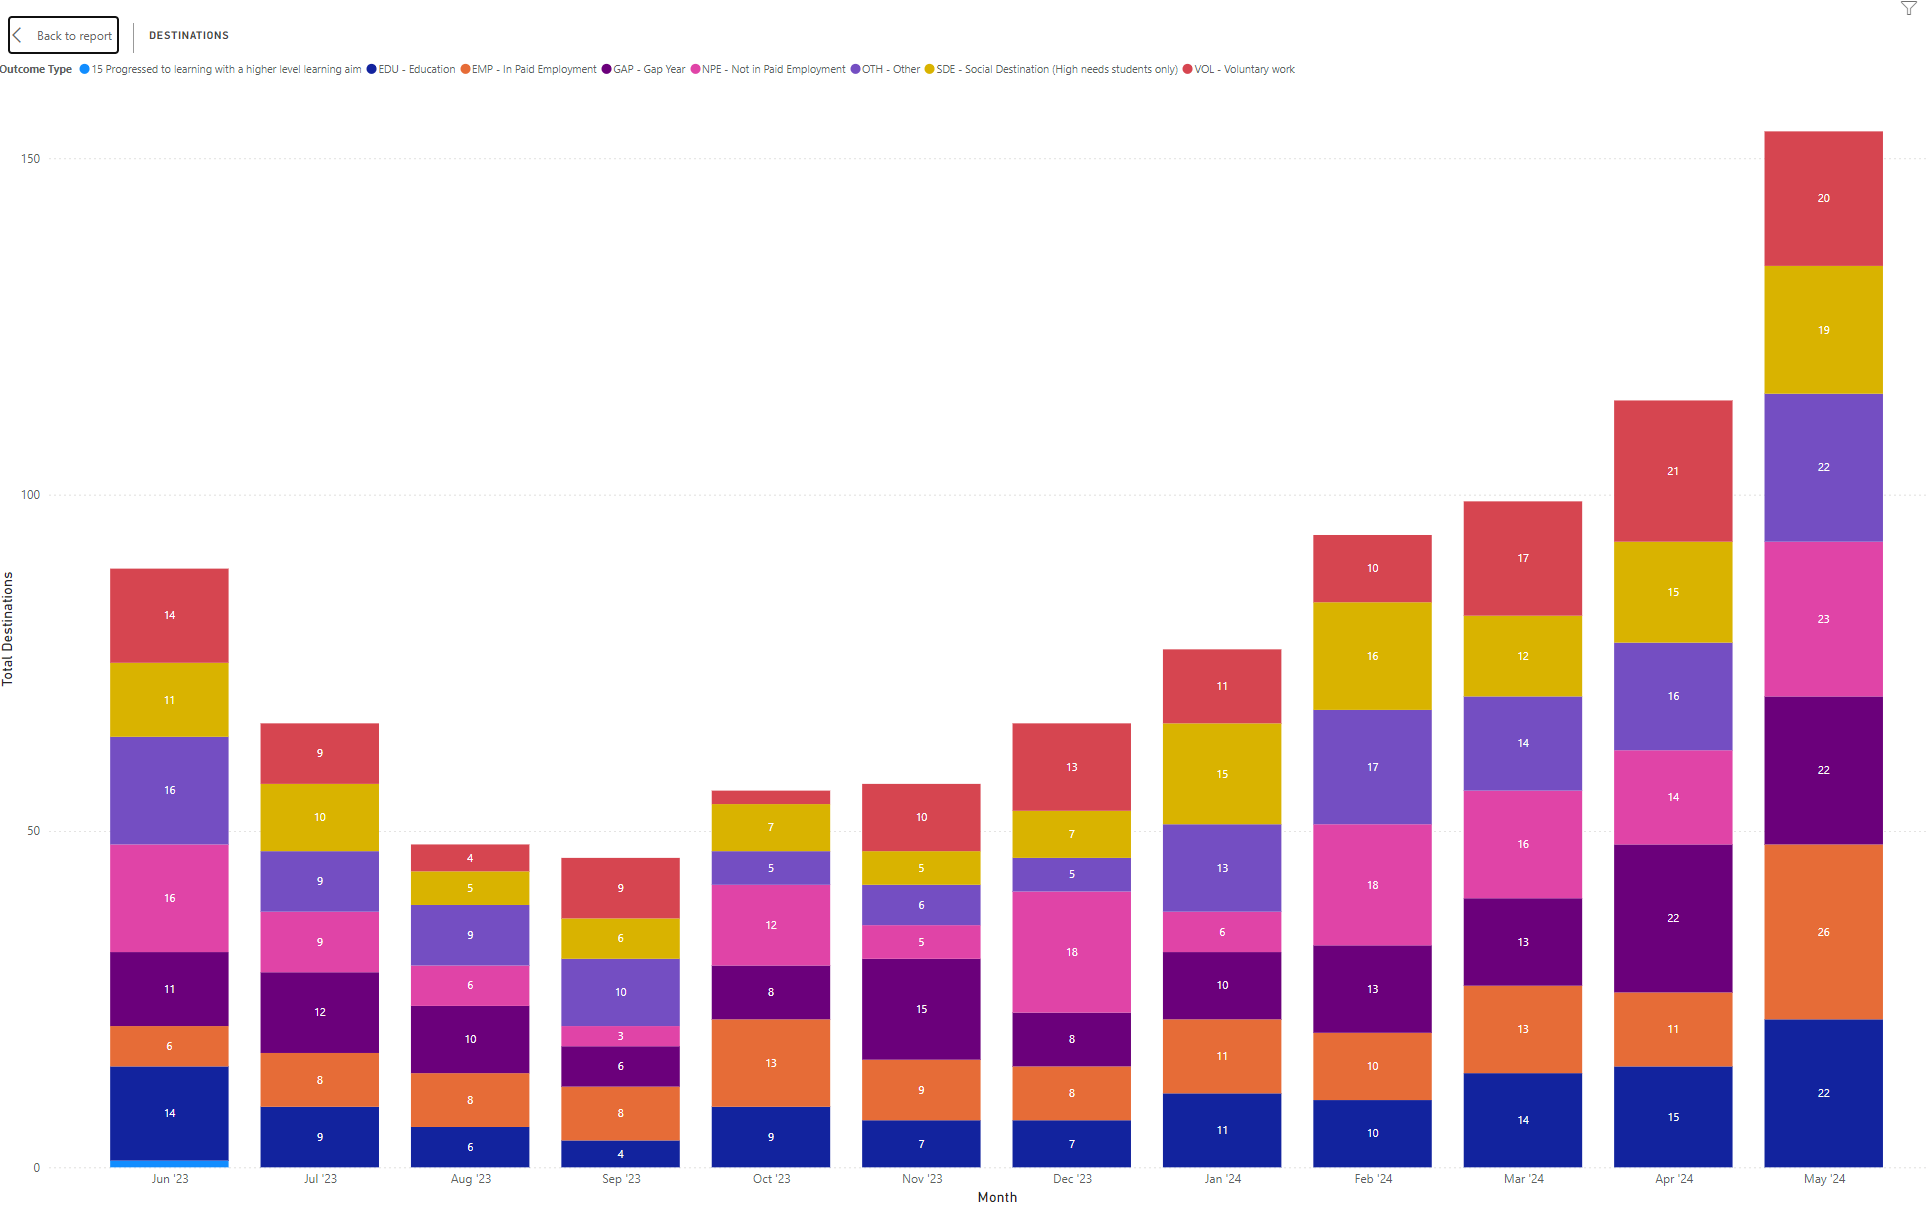
Click the Back to report button at the top-left to return to the main dashboard view.
Export Chart Data to .csv
Charts can be exported to a .csv file as follows:
-
Move the cursor over the chart so the toolbar appears at the top-right.

-
Click the
 button and select Export data from the menu that appears.
 -
You will be prompted to choose where to save the file. Click Save when ready.
Date columns may display ###### when the .csv file is opened. Expanding the column will display the dates.
Data Filters
Dashboard Filters
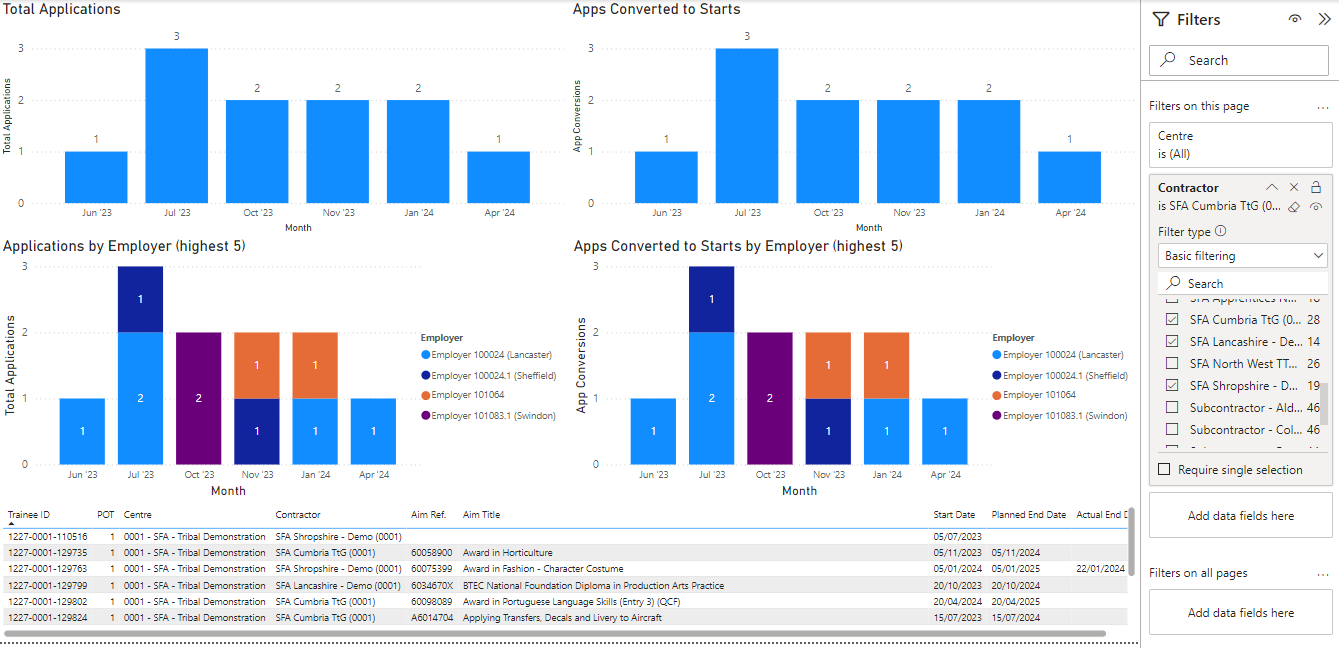
Each dashboard contains filters for centre and contractor (as well as some dashboard-specific filters) that allow you to narrow down the data. These can be found to the right of the dashboard.
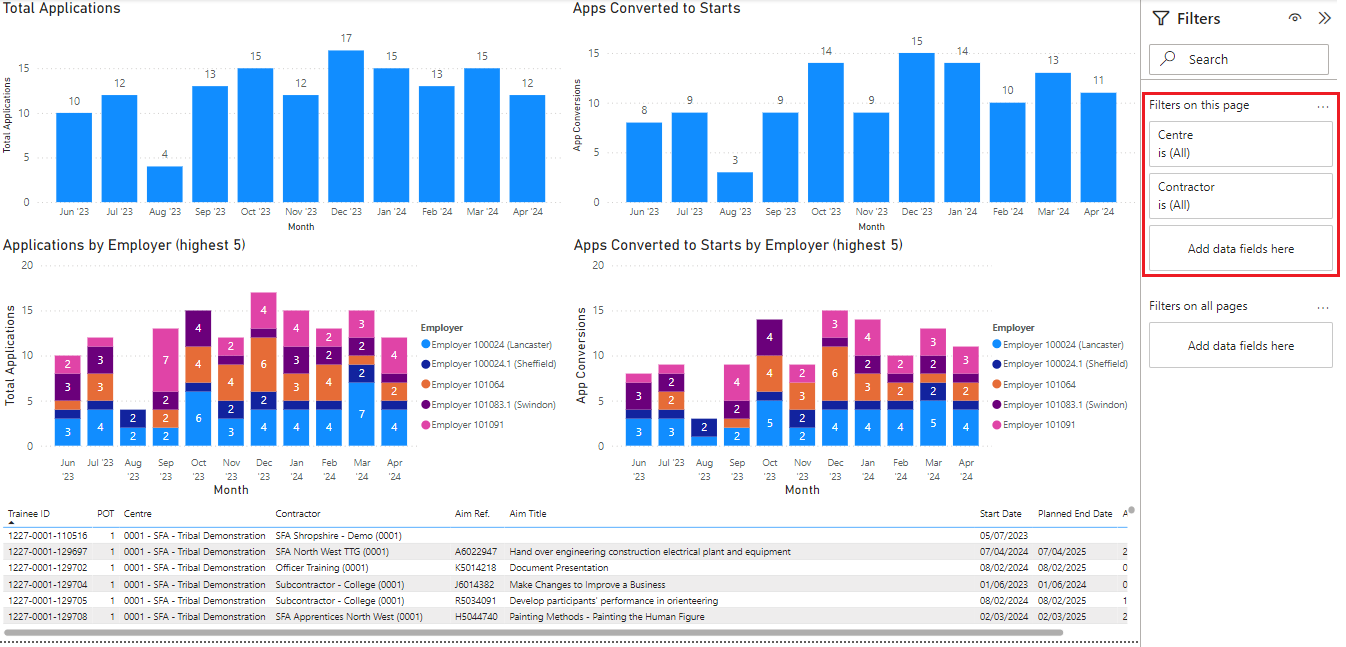
To use the filters:
-
Click the filter you wish to use. It will expand to display all available values.

-
Tick the checkbox next to each value you wish to display on the dashboard. The chart data will automatically filter with each selection.
-
To remove a selection, simply click it again to untick it. If you wish to clear all selections, hover the cursor over the filter until the tools appear at the top-right of the panel, then click the
 button. This will return the filter to its default of displaying all values.
 -
To collapse a filter, click the
 button at the top-right of the filter's panel.
Chart Data Filtering
Clicking data on a chart will highlight all matching data across all charts on the dashboard.
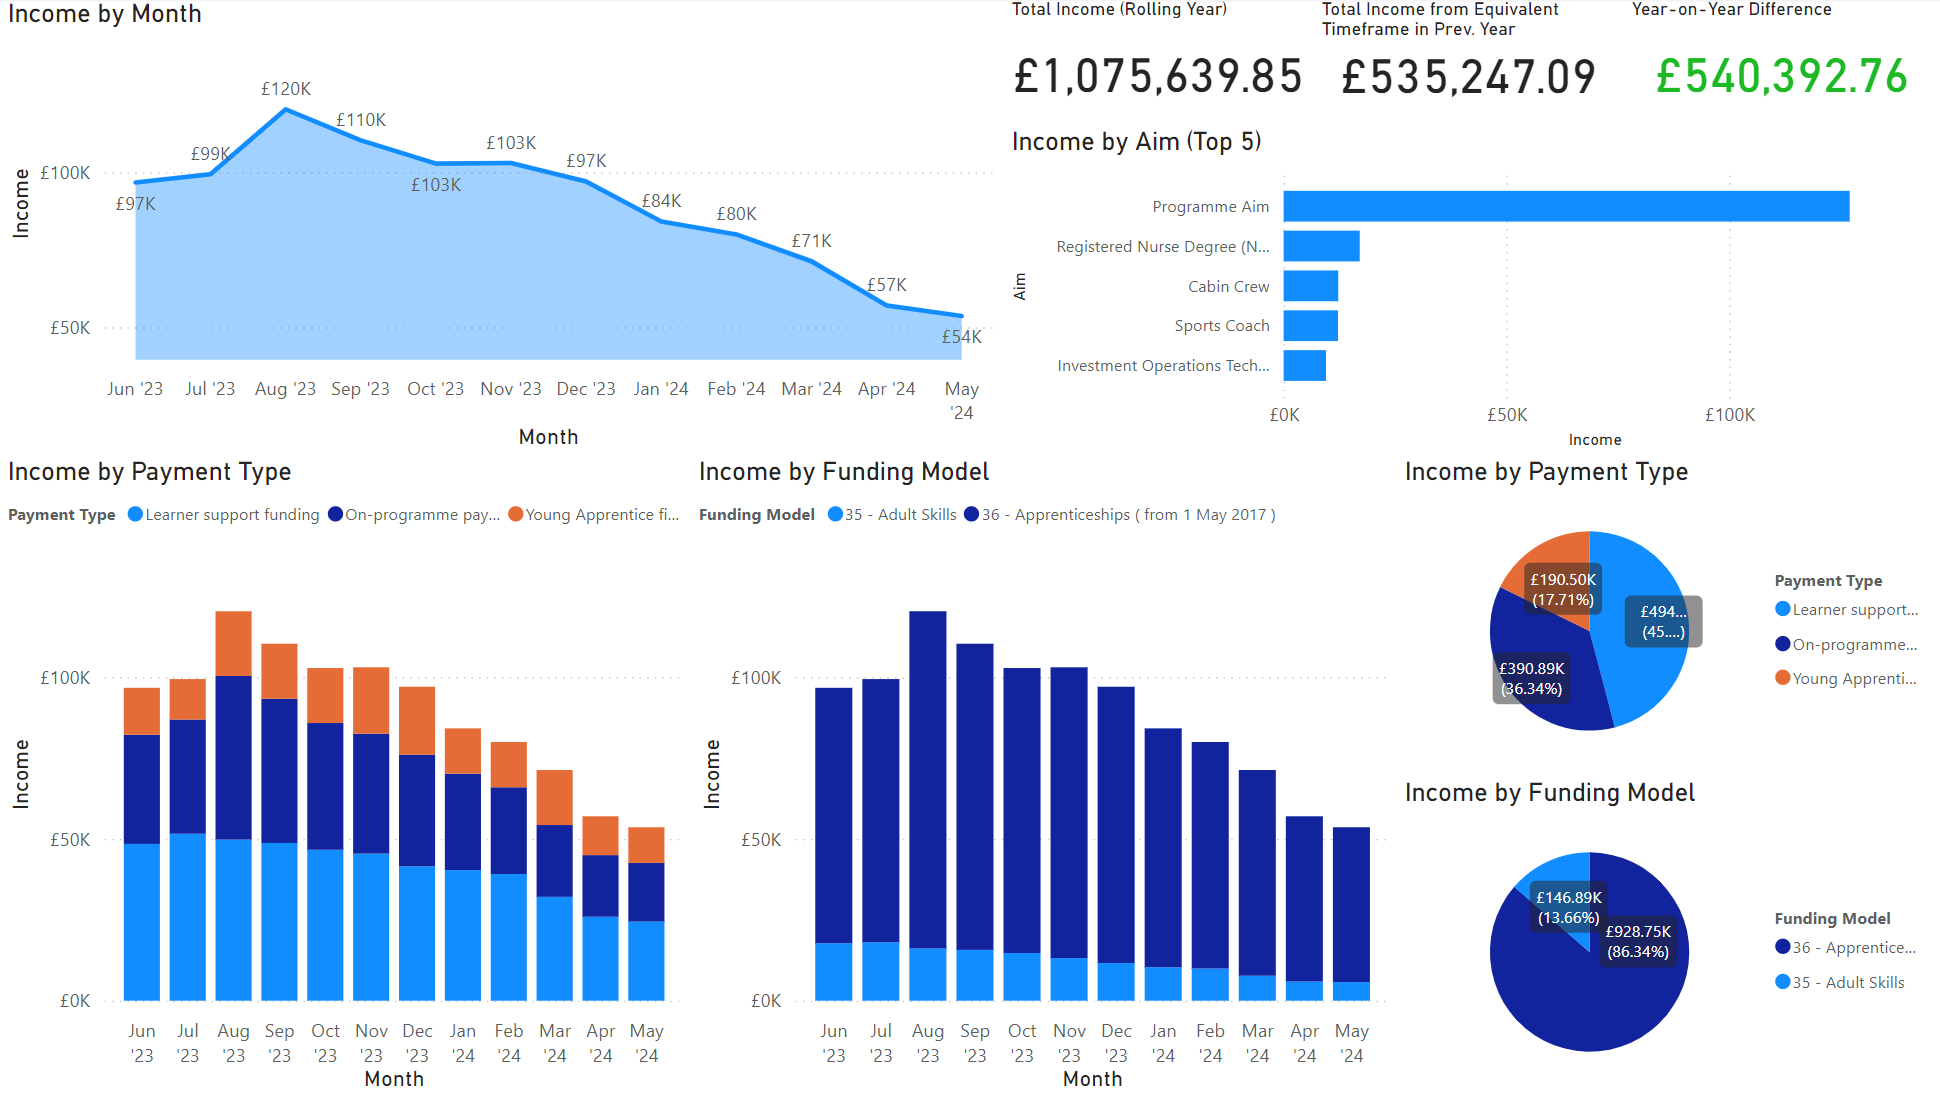
For example, on the Finance dashboard, clicking a value in the Income by Funding Model chart will filter the entire dashboard by that funding model.
This is the dashboard before selecting a value:
This is the dashboard after selecting funding model 35:
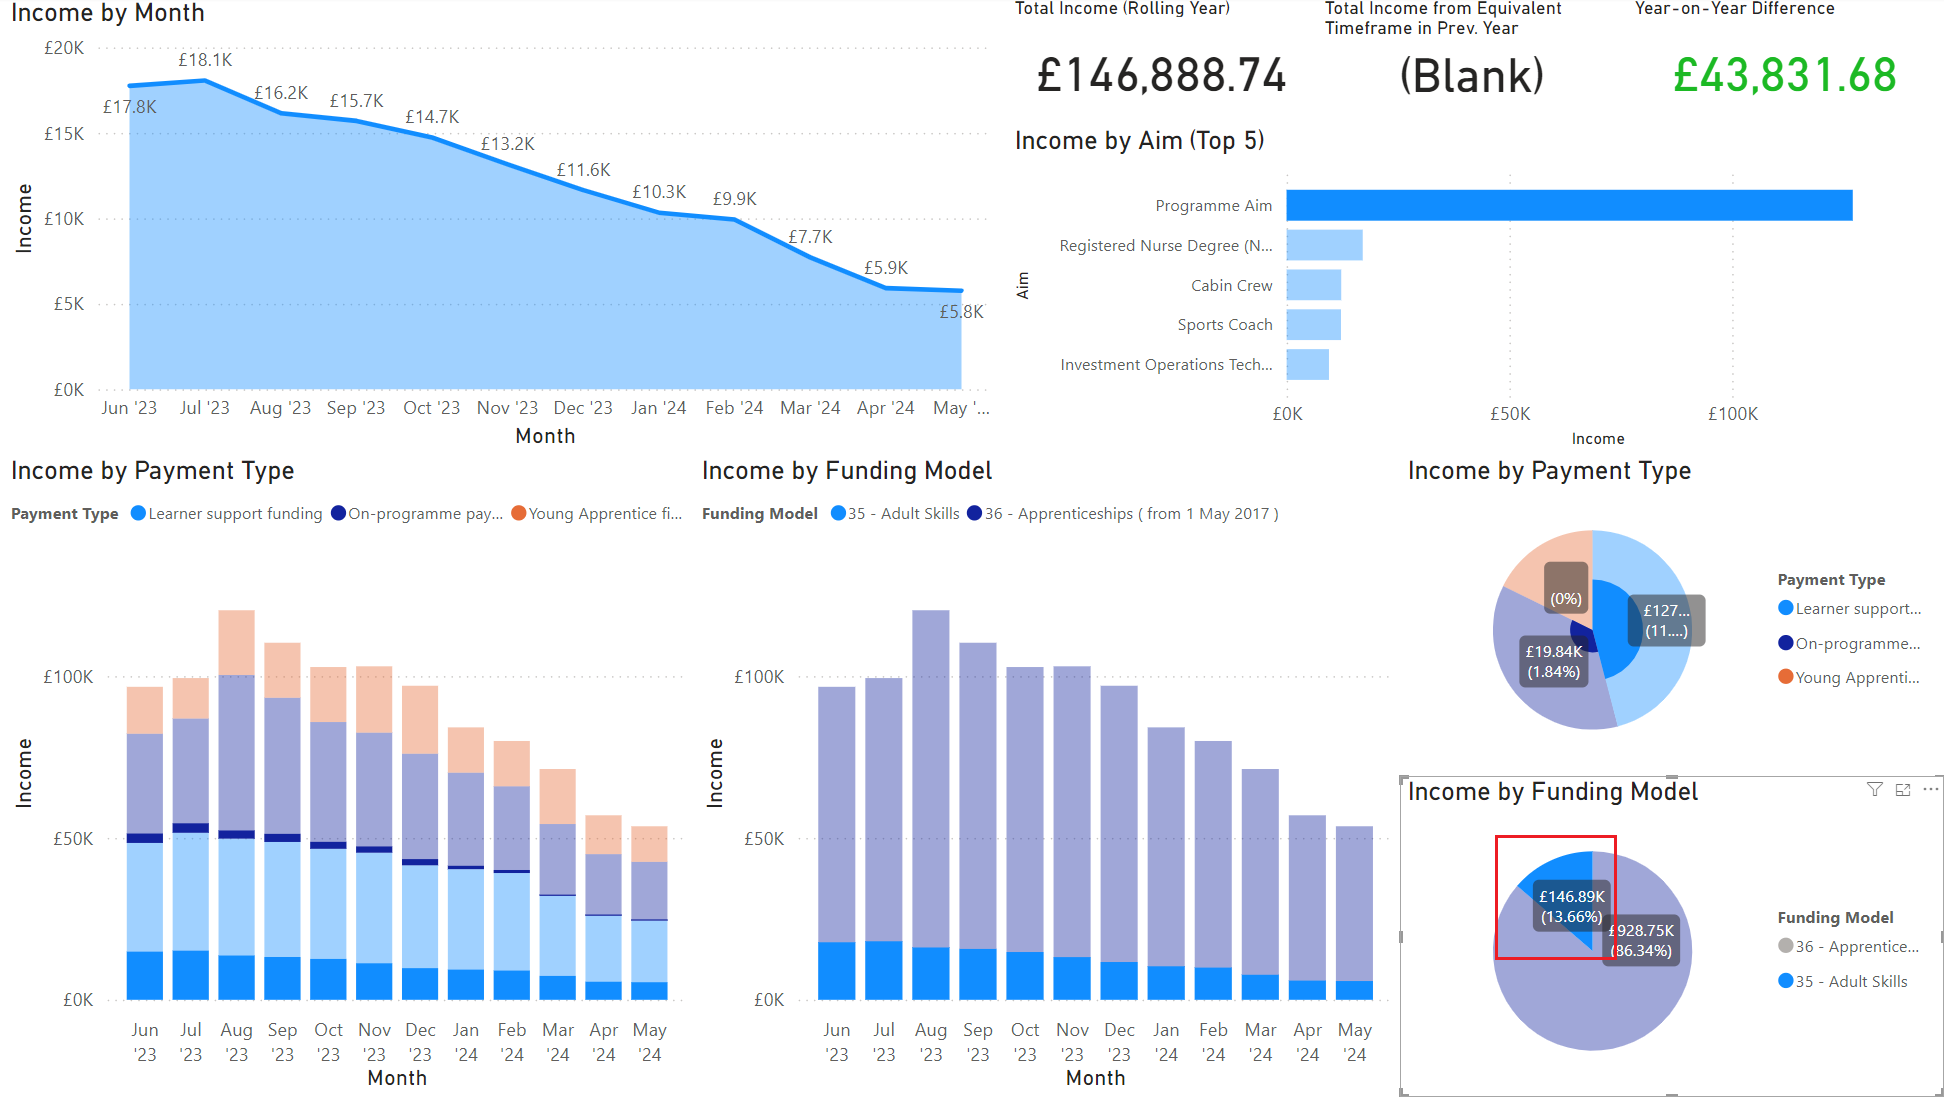
Data not relating to FM35 is faded out, while data which does relate to it remains bold. This can help identify trends or potential issues around specific data points.
A small number of charts will not filter data along with the rest of a dashboard, due to the way their data is derived. In the above example, the figure for Total Income from Equivalent Timeframe in Prev. Year displays at blank when a chart filter is applied, because the data for it is calculated independently of the rest of the dashboard.
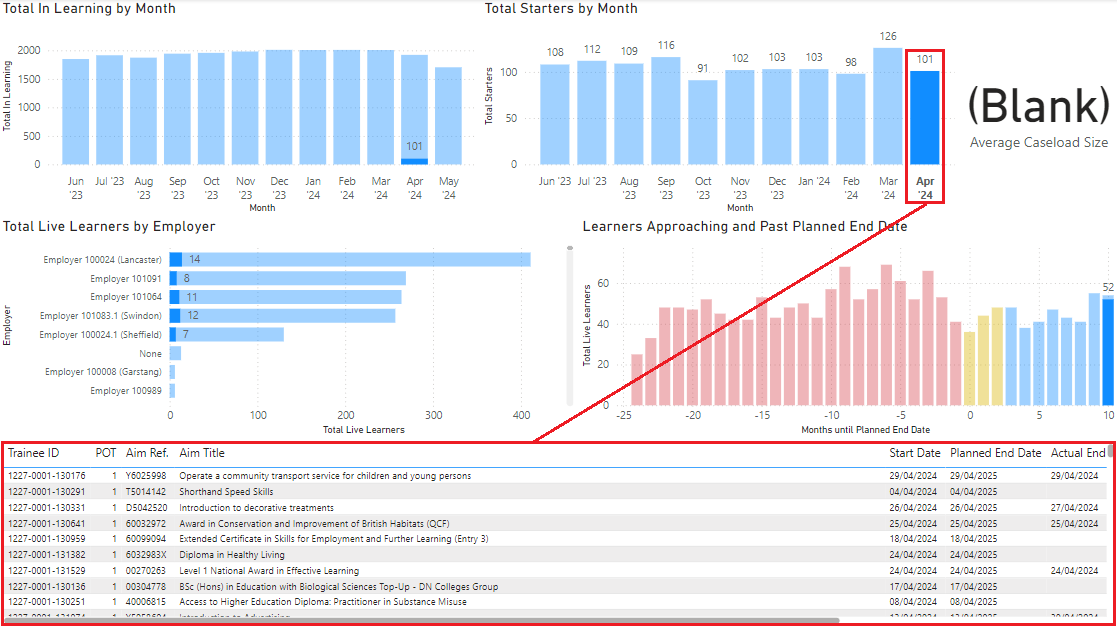
This can also be used to produce a list of learners on most dashboards. For example, on the In Learning dashboard, clicking a column in the Total Starters by Month chart will filter the table at the bottom of the dashboard so that it produces a list of starters for the selected month. This can then be exported to a .csv file for further use or analysis.
Data Security
It is important that users of Maytas BI understand that the data used on the dashboards is stored locally in the Power BI .pbix file. As such, the data that is downloaded from the Maytas database has been restricted so that Trainee ID and Assessor ID are the only fields used to identify an individual, which means they are not identifiable without access to related data in the database. Additionally, demographic data is not included on the dashboards for security purposes.
While the dashboard data is intentionally limited in scope, it is still important that users are aware that this data will be stored locally and therefore should be treated with appropriate care and security.
The specific data downloaded from the Maytas database to the .pbix file when a data refresh is performed in Power BI Desktop is the contents of the following tables:
-
BI2_APPLICANTS_CACHE
-
BI2_BUSINESS_HEALTH_CHECKv2_CACHE
-
BI2_FINANCE_CACHE
-
BI2_INLEARNING_CACHE
-
BI2_LEAVERS_CACHE
-
BI2_PROGRESS_CACHE
-
BI2_QAR_CACHE
These tables are populated with the stored procedure BI_CACHE_REFRESH, which can be scheduled to run periodically.