Apprenticeship Accountability Framework
The Apprenticeship Accountability Framework report shows risk areas for providers along with a risk rating, based on the Apprenticeship Accountability Framework documentation and guidance.
Clicking on a figure will show a drilldown of the learners and aims which comprise that figure. The columns included in the drilldown are specific to that particular indicator, to show data relevant to the derivation of the figure.
Parameters
-
Year - Shows data for the selected year.
-
Centre - Filters by the selected centres.
-
Contractor - Filters by the selected contractors.
-
Merge planned break / restart POTs into single record - See below for details.
-
Use exported or live data - Determines whether certain field values (planned end date, actual end date, achievement date, completion status and outcome) are taken from an ILR export or from their current values in the database. Typically exported data would be used for attempting to reconcile with published ESFA figures for a particular period, whereas live data shows the figures as they currently stand. Note that this does not apply to the QAR figures in the report, as they are handled separately.
-
Export to use - Determines the ILR export file to use. Regardless of whether the previous parameter is set to use exported or live data, the report will use the selected export file to determine the total apprentices. Note that this does not apply to the QAR figures in the report, as they are handled separately.
-
UKPRN - This allows learners counted in the report to be filtered by specific UKPRNs.
-
Exclude transfers within provider from withdrawals - When set to Yes (the default), learners with a programme aim withdrawal reason of 40 will be excluded from the Withdrawals count in the report. When set to No, these learners will be counted as withdrawals.
Currently, the Apprenticeship Accountability Framework specification makes no mention of how transfers within a provider should be handled with regards to withdrawals. However, there is evidence to suggest that the ESFA does exclude these learners from the Withdrawal figures, and so the parameter allows for both possibilities.
-
Ready to run - Set this to Yes once all other parameters have been set as required.
Criteria
The following should be noted while reading the criteria:
-
References to @year mean the year selected in the parameters.
References to contractyear mean the contract year selected in the parameters; e.g. 2021/22 = 2122.
-
References to totalapps mean the total apprentices counted in the year, defined as POTs where:
-
programme type is 2, 3, 10, 20, 21, 22, 23 or 25
-
AND the programme aim is active in the selected year, based on programme aim dates (e.g. for 2021/22, programme start date is <= 31/07/2022 and either programme actual end date is not entered or is >= 01/08/2021)
-
-
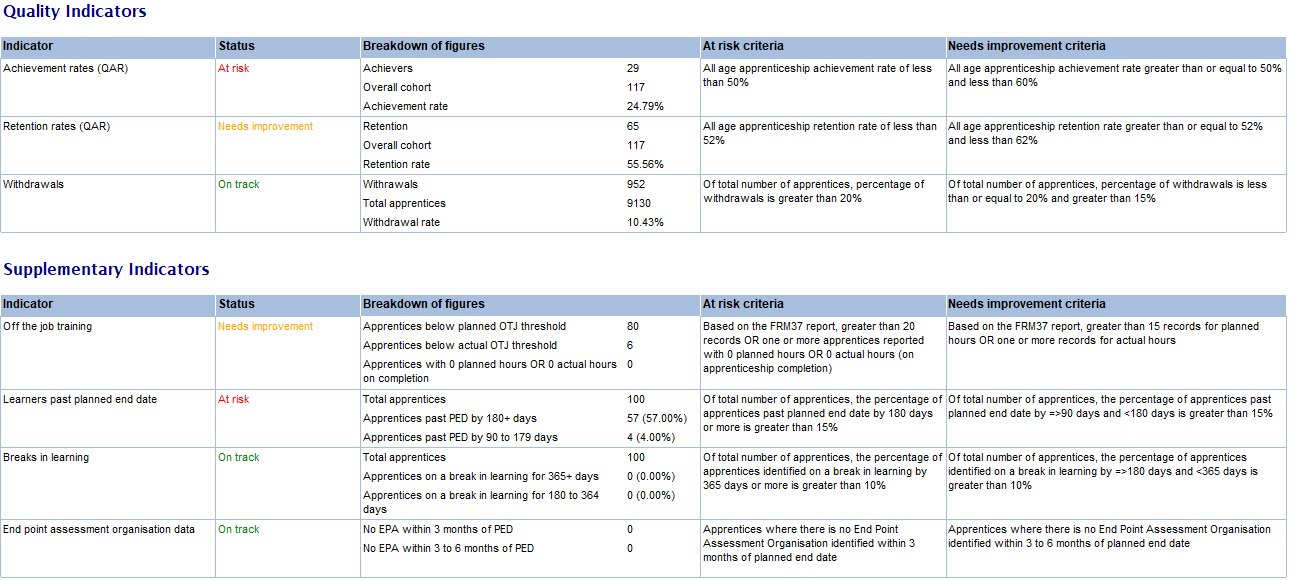
If neither the At Risk or Needs Improvement criteria is met, the status is considered On Track. If the criteria is met for both At Risk and Needs Improvement, the status is At Risk.
| Indicator | Figure | Derivation | At Risk | Needs Improvement |
|---|---|---|---|---|
| Achievement rates (QAR) | Achievers | TRAINEEPPR.FRAME = @year | Achievement rate < 50% | Achievement rate >= 50% and < 60% |
| Overall cohort | TRAINEEPPR.OVERALLCOHORT = @year | |||
| Achievement rate | Percentage of achievers / overall cohort | |||
| Retention rates (QAR) | Retention | TRAINEEPPR.RETENTION = @year | Retention rate < 52% | Retention rate >= 52% and < 62% |
| Overall cohort | TRAINEEPPR.OVERALLCOHORT = @year | |||
| Retention rate | Percentage of retention / overall cohort | |||
| Withdrawals | Withdrawals | totalapps where programme aim completion status [TRAINEEPOT2.ILR11_PROG_COMPLETIONSTAUS] = 3 | Withdrawal rate > 20% | (Withdrawal rate <= 20% and > 15%) |
| Total apprentices | totalapps | |||
| Withdrawal rate | Percentage of withdrawals / totalapps | |||
| Off the job training | Apprentices below planned OTJ threshold |
First, the minimum weekly OTJ hours is derived based on the employment status Employment Intensity Indicator (EII) as:
(EII values 1 to 4 are ignored as they are no longer used.)
Next, the planned programme length in weeks is derived as the number of weeks between the programme start date and planned end date. The method used for measuring weeks is the SQL Server datediff function; i.e. datediff(week,[prog start date],[prog planned end date]).
The annual leave adjustment is set at 0.892, which is rounded from the ESFA's multiplier of (1 - (5.6 / 52)).
The total minimum required OTJ hours is calculated as: minimum weekly hours x planned weeks x 0.892 x 0.2 e.g. With an EII of 8 and a planned programme length of 52 weeks, the total min required OTJ hours would be: 30 x 52 x 0.892 x 0.2 = 278.304 hours.
The ILR planned hours (TRAINEEPOT.ILR_1920_PLANNEDHOURS) and actual hours (TRAINEEPOT.ILR_2021_ACTHOURS) are then each compared against the min OTJ hours. If the planned hours are less than the min OTJ hours, the learner is considered below the minimum required planned hours. |
totalapps below planned OTJ threshold +totalapps below actual OTJ threshold > 20 OR totalapps present with 0 planned hours or 0 actual hours |
totalapps below planned OTJ threshold > 15 OR totalapps below actual OTJ threshold > 0 |
| Apprentices below actual OTJ threshold | Derive figures as above. If the actual hours are less than the min OTJ hours AND the programme completion status is 2 (completed), the learner is considered below the minimum required actual hours (i.e. the actual hours are only relevant if the learner has completed). | |||
| Apprentices with 0 planned hours OR 0 actual hours on completion | totalapps where planned hours [TP.ILR_1920_PHOURS] = 0 OR actual hours [TP.ILR_2021_ACTHOURS] = 0 | |||
| Learners past planned end date | Effective end date for year (ref. End Date) |
If selected year is not the current contract year, then 31st July of the selected year If selected year is the current contract year, then:
|
Apprentices past PED by 180+ days percentage > 15% | Apprentices past PED by 90 to 179 days percentage > 15% |
| Days past PED |
If not in Gateway (i.e. completion status is not 1 or outcome is not 8 or achievement date is entered), then days between planned end date and (if actual end date is after End Date or is not entered, then (End Date, else actual end date) If in Gateway (i.e. completion status = 1 and outcome = 8 and achievement date is not entered), then days between planned end date and End Date |
|||
| Total apprentices | totalapps | |||
| Apprentices past PED by 180+ days |
If not in Gateway, Days past PED >= 180 and completion status is 1 or 2 If in Gateway, days between planned end date and End Date >= 180 |
|||
| Apprentices past PED by 90 to 179 days |
If not in Gateway, Days past PED >= 90 and < 180 and completion status is 1 or 2 If in Gateway, days between planned end date and End Date >= 90 and < 180 |
|||
| Breaks in learning | Total apprentices | totalapps | Apprentices on a break in learning for 365+ days percentage > 10% | Apprentices on a break in learning for 180 to 364 days percentage > 10% |
| Apprentices on a break in learning for 365+ days |
First, derive norestart (i.e. learners on a break with no restart record) as totalapps where:
If all the above is true, norestart = Y Next count daysonbreak as the days between the programme aim actual end date on the break record and the current date The final figure is the totalapps where norestart = Y and daysonbreak >= 365 |
|||
| Apprentices on a break in learning for 180 to 364 days |
Derive norestart and daysonbreak as above The final figure is the totalapps where norestart = Y and daysonbreak >= 180 and < 365 |
|||
| End point assessment organisation data | No EPA within 3 months of PED |
First, derive liveapps as totalapps where no programme aim actual end date is entered (i.e. live records) and where there is no prog aim EPA organisation ID entered [TRAINEEPOT.ILR_1718_PROG_EPAORGID] Then count liveapps where the programme planned end date <= current date + 3 months |
No EPA within 3 months of PED > 0 | No EPA within 3 to 6 months of PED > 0 |
| No EPA within 3 to 6 months of PED | Derive liveapps as above, then count liveapps where the programme planned end date > current date + 3 months and <= current date + 6 months |
Merge multiple POTs into single programme
The Apprenticeship Accountability Framework report will by default merge multiple POTs from planned breaks / restarts into a single programme in the results. This can be toggled with the Merge planned break / restart POTs into a single record parameter.
This feature is implemented in the Withdrawals, Off the job training, Learners past planned end date and End point assessment organisation data measures, so that programmes that have restarted are not counted more than once.
The feature is not implemented in the Achievement rates, Retention rates and Breaks in learning measures, as these have their own specific rules for how breaks / restarts are measured and presented.
POTs are merged into a single programme by first identifying POTs where the programme aim completion status is 6 or the restart indicator is 1. These POTs are then matched as part of the same programme on ULN, learner reference number, UKPRN and framework or standard code. The following data is then used in the measures:
| Field | Data used |
|---|---|
| POT | Latest POT in the programme (based on start date) |
| Start date | Earliest programme start date of all POTs in the programme |
| Planned end date | Latest programme planned end date of all POTs in the programme |
| Actual end date | Latest programme actual end date of all POTs in the programme |
| Completion status | Latest programme completion status of all POTs in the programme |
Use of exported data
The report uses exported ILR data as the basis for which apprentices to include (see below) for certain measures. The ILR export file that is used can be selected with the Export to use parameter, which defaults to the most recent export for the selected year (note that only ILR exports that have been output to an XML file can be selected).
Additionally, the parameter Use exported or live data determines whether the affected measures use the ILR field values (e.g. completion status, actual end date, etc) from the export file or whether they should use the live field values (i.e. what is currently displayed on the ILR tabs in Maytas).
Using exported data can help to reconcile results in Maytas more closely with the ESFA results, whereas using live data can help to predict what results would look like as the data currently stands.
For example, if you want to reconcile the full-year results for the previous contract year, selecting your most recent R14 export file for that year and choosing to use exported data would produce the most accurate match. If you wanted to show expected results for the current year, however, you would select your most recent export for the current year and choose to use live data.
Total Apprentices calculation
The total apprentices counted for certain measures is based on the apprentices included in the selected ILR export file, which reflects how the ESFA determine the total apprentices. This may include learners who were not actually in learning during the selected contract year (e.g. late notified data changes).
The following measures use export files to determine the total apprentices:
-
Withdrawals
-
Off the job training
-
Learners past planned end date
-
Breaks in learning
-
End point assessment organisation data
The QAR measures do not use this, as they use a separate methodology based on the QAR specifications.
Note that the total apprentices will still be based on exported data when the Use exported or live data parameter is set to use live data, as the parameter only affects whether the field values for the learners is taken from live data or the export file.
QAR Benchmarks
The Apprenticeship Accountability Framework report includes a QAR Benchmarking section, which shows how your achievement rates compare to the national average.
This first requires the national figures to be imported into the system via a Standard Import:
The relevant national figures data file has been modified to include totals only and is included with this release for convenience. The original files for national QAR figures can be downloaded from the FE and Skills website.
-
In Maytas 5, go to Exports on the toolbar and click the Standard Import button.
-
Click the Browse button at the end of the Csv/Excel File row.
-
Browse to the Maytas 5\Extras\Reports Library\QAR Benchmarking folder of the release, select et_narts_provider_summary - Totals only.csv and click Open.
-
Click the Browse button at the end of the Control File row.
-
Browse to the Maytas 5\Extras\Reports Library\QAR Benchmarking folder of the release, select QAR National Figures Import - Providers.CON and click Open.
-
Ensure the First row contains headers box is ticked.
-
Click Next.
-
A preview of the data to be imported will be shown. Click Next.
-
The data will now be imported to the QAR_NATIONAL_FIGURES_PROVIDER table of the database. Click Finish.
Once the data is imported, the QAR Benchmark section of the report will be populated.
The ranking and thresholds are based on the QAR benchmarking section of the Apprenticeship Accountability Framework specification.
The results are only affected by the Year parameter, which determines the achievement rates cohort year and the national QAR year to use (note that the national figures only cover 21/22 and 22/23, so 21/22 is used if an earlier year is selected and 22/23 is used if a later year is selected).
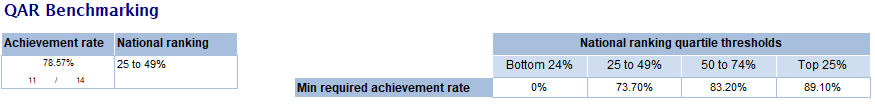
The benchmarking works by ordering the national QAR figures by achievement rate (ascending) and then splitting them into percentage quartiles (i.e. bottom 24%, 25-49%, 50-74% and top 25%). When the report is run, your total achievement rate for the year is placed in the appropriate quartile, based on whether your achievement rate is greater than or equal to the lowest achievement rate in the quartile.
For example, the national thresholds for 2022/23 are:
-
Bottom 24% quartile = 0% achievement rate
-
25 to 49% quartile = 75.6% achievement rate
-
50 to 74% quartile = 83.5% achievement rate
-
Top 25% quartile = 89.3% achievement rate
Therefore if a provider's achievement rate was e.g. 76%, that would place them in the 25 to 49% quartile, as they are above the threshold of 75.6% but below the threshold for the next quartile.
Note that when the national QAR figures are ordered and divided, rows where the achievement rate is c, x or z are ignored, as these are rows where data is unavailable, statistically irrelevant or hidden.