Pipeline over Time
The Pipeline over Time report shows counts of learners in open, closed, won and lost opportunities for each month in a contract year.
Parameters
- Contract year - This lets you choose the contract year to show in the report.
- Sales grouping - This filters by the selected sales groupings. All groupings are selected by default.
Layout
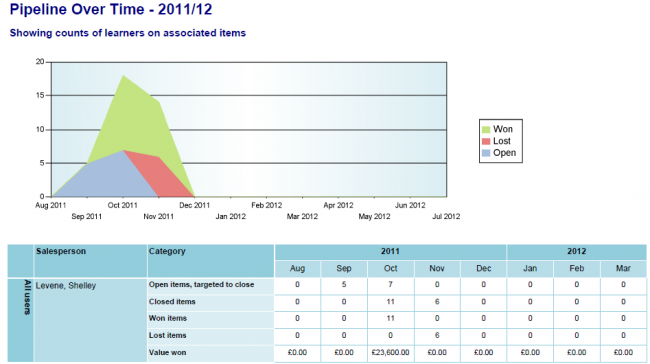
The report shows an area chart at the top showing the number of learners in won, lost and open opportunities over time. A number of observations can be made from the chart:
- The green and red areas combined shows the number of learners in closed opportunities.
- The red and blue areas combined shows the missed potential.
- The overall green, red and blue areas show the total potential.
The table below the chart shows the numbers learners in open items which are targeted to close in each month/year, closed items, won items and lost items, and the value won. These are grouped by salesperson.
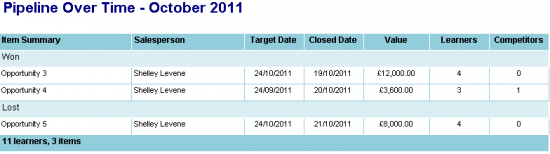
Won and lost opportunities are determined by the weighting percentage of the opportunity, with won items having a close date and weighting of 100% and lost items having a close date and a weighting of 0%.
The months can be collapsed to show yearly totals by clicking the + and - buttons on the year headers. Similarly, the salesperson groupings can be collapsed by clicking the + and - buttons on the All Users column at the far left of the table.
Clicking on a count will show a drilldown report detailing the relevant opportunities.