Targets over Time
The Targets over Time report shows targets, forecasts and actual counts of learners in opportunities for each month in a contract year.
Parameters
- Contract year - This lets you choose the contract year to show in the report.
- Sales grouping - This filters by the selected sales groupings. All groupings are selected by default.
Layout
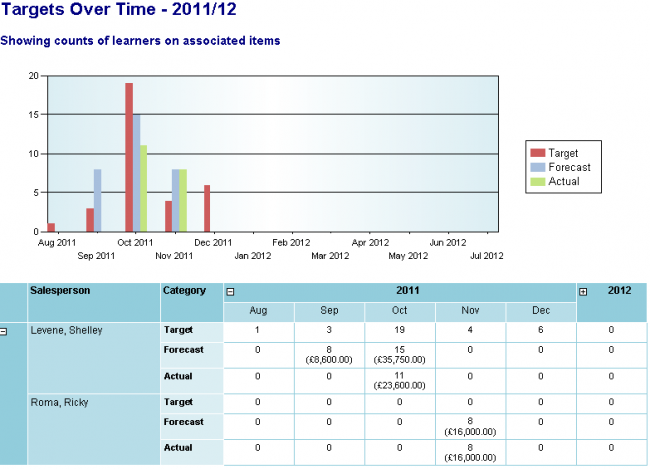
The report shows a bar chart at the top showing the targeted, forecasted and actually achieved number of learners in opportunities over time.
The table below the chart shows these figures grouped by salesperson.
The months can be collapsed to show yearly totals by clicking the + and - buttons on the year headers. Similarly, the salesperson groupings can be collapsed by clicking the + and - buttons on the All Users column at the far left of the table.
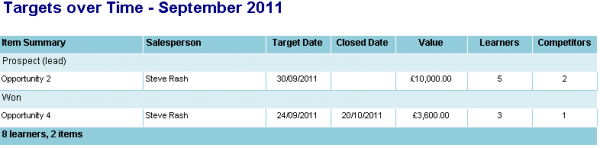
Clicking a forecast or actual value will show a drilldown report detailing the relevant opportunities. Please note that it is not possible to drill down to target counts, as these are targets which are entered directly into Maytas 5 and are not representative of any actual learners or opportunities.