Applicants (Pipeline)
Overview
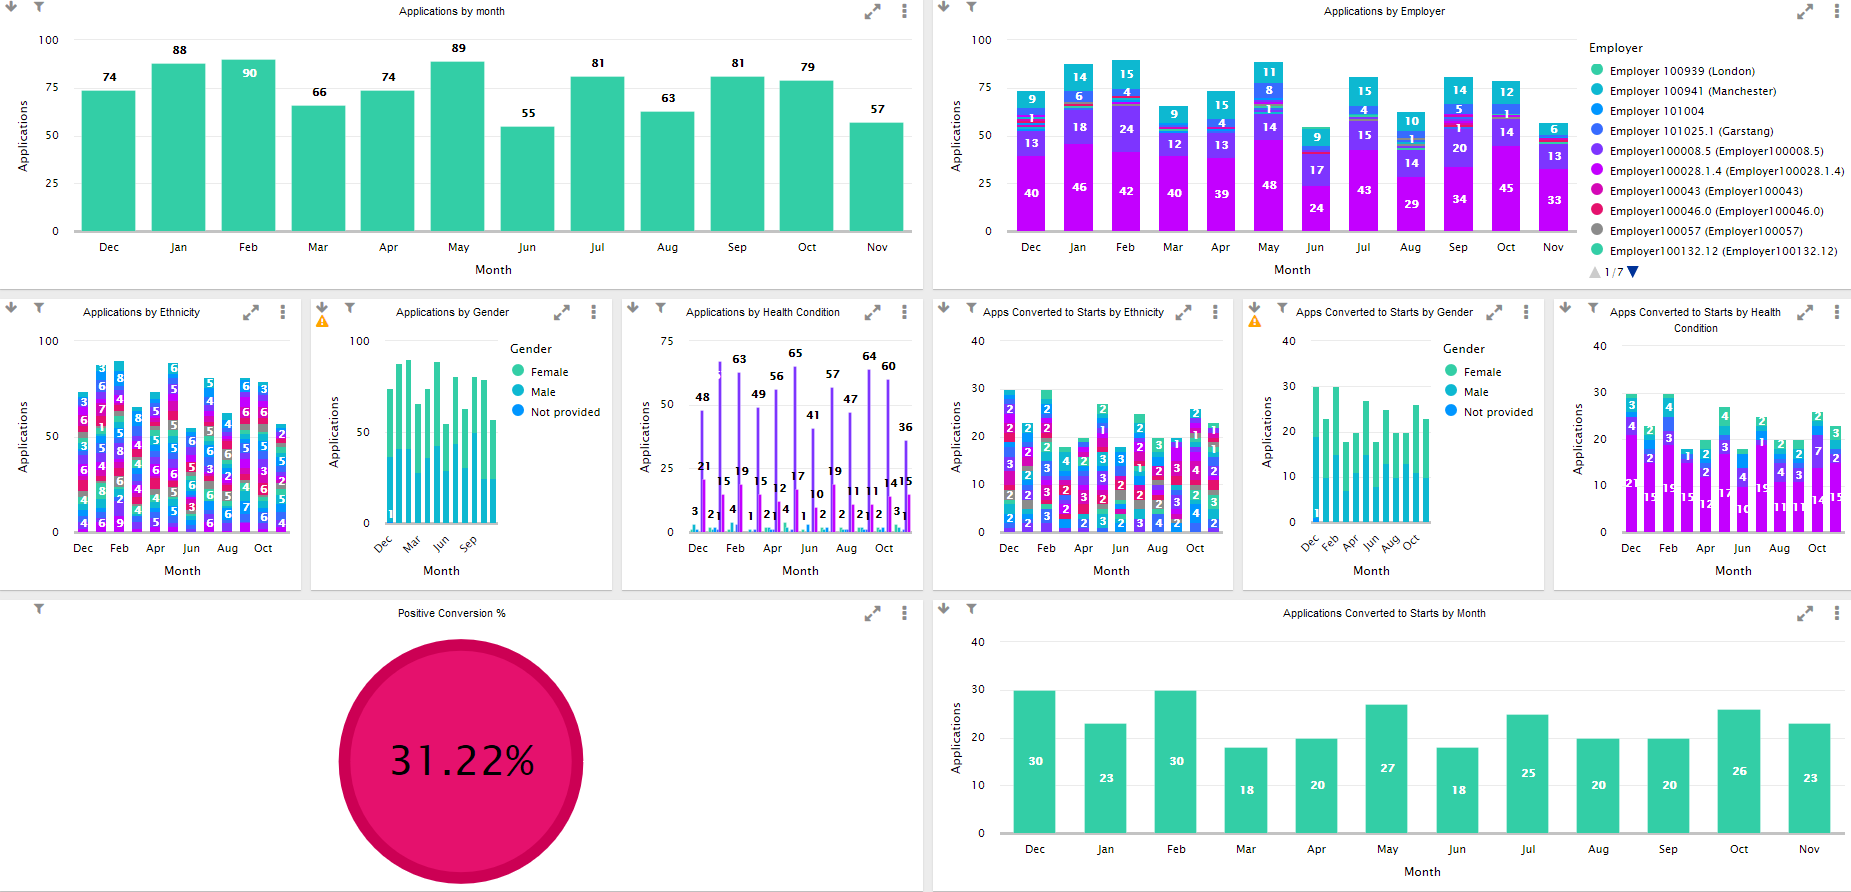
The Applicants (Pipeline) dashboard shows data about learners on applicant contractors, which can be specified via a system config option. The charts can help identify demographic trends in applicants, as well as showing the proportion of applicants who have progressed to becoming a starter.
Not seeing any data on this dashboard? You need to designate at least one contractor as an applicant contractor - click here for details.
Applicant Contractor Config
Only learners who are on a designated applicant contractor are shown on the Applicants dashboard. Multiple contractors can be designated as required. Please note that this config only affects the BI dashboards and does not cause the contractors to be treated differently in Maytas or Maytas Hub.
- In Maytas, click the M5 button at the top left and click Options.
- Scroll down to the Others section on the left and select BI.
- Tick the box next to Contractors to use for applicants.
- Enter the contractor ID of each contractor you wish to designate as an applicant contractor, separated by a comma (e.g. 9999-0001-001,9999-0001-002,9999-0001-003). The IDs can be found in the CONTRACTOR table, or by selecting a contractor in the Contracts editor and viewing the Details tab.
- Click OK.
Charts
Applications by Month
Shows the number of applicants each month, based on the POT start date for learners on an applicant contractor.

Applications by Employer
Shows the number of applicants each month split by employer, based on the POT start date for learners on an applicant contractor. You can click on one or more employer names on the right to only show data for those employers.
If a learner has multiple employers associated with them, the selected employer record is the one with the most recent employment start date (TREMPLOYER.STARTDATE) that was active during the POT.

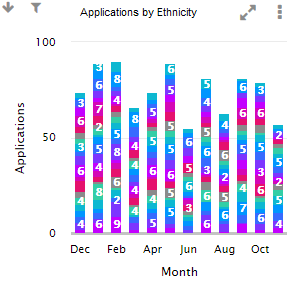
Applications by Ethnicity
Shows the number of applicants each month split by ethnicity, based on the POT start date for learners on an applicant contractor.
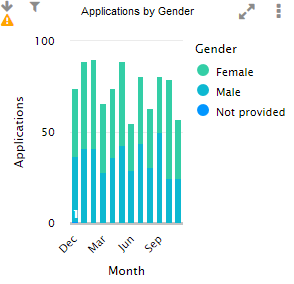
Applications by Gender
Shows the number of applicants each month split by gender, based on the POT start date for learners on an applicant contractor.
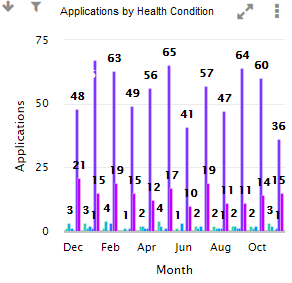
Applications by Health Condition
Shows the number of applicants each month split by health condition, based on the POT start date for learners on an applicant contractor.
This uses LP30 Disability Type for LLWR learners and Primary LLDD and health problem for ILR learners.
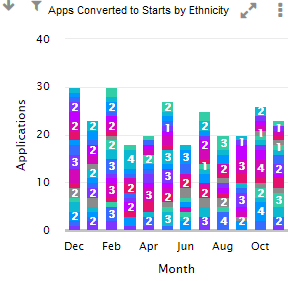
Apps Converted to Starts by Ethnicity
Shows the number of applicants each month, split by ethnicity, who subsequently became a full starter on a non-applicant contractor. The month in which the learner is counted is determined by the POT start date of the original application, not the conversion to a start.
An applicant is considered to have converted to a start if:
-
they have another POT on a non-applicant contractor where the POT start date is greater than the POT termination date of the applicant POT
OR
- the application and conversion to start were recorded on a single POT, and there is a record in M32$_WEB_USERCHANGES of the contractor ID being changed on that POT from an applicant contractor to a non-applicant contractor.
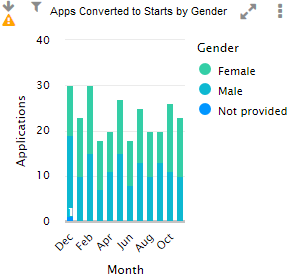
Apps Converted to Starts by Gender
Shows the number of applicants each month, split by gender, who subsequently became a full starter on a non-applicant contractor. The month in which the learner is counted is determined by the POT start date of the original application, not the conversion to a start.
An applicant is considered to have converted to a start if:
-
they have another POT on a non-applicant contractor where the POT start date is greater than the POT termination date of the applicant POT
OR
- the application and conversion to start were recorded on a single POT, and there is a record in M32$_WEB_USERCHANGES of the contractor ID being changed on that POT from an applicant contractor to a non-applicant contractor.
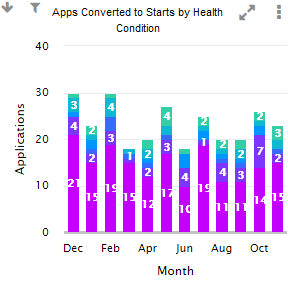
Apps Converted to Starts by Health Condition
Shows the number of applicants each month, split by health condition, who subsequently became a full starter on a non-applicant contractor. The month in which the learner is counted is determined by the POT start date of the original application, not the conversion to a start.
Health condition uses LP30 Disability Type for LLWR learners and Primary LLDD and health problem for ILR learners.
An applicant is considered to have converted to a start if:
-
they have another POT on a non-applicant contractor where the POT start date is greater than the POT termination date of the applicant POT
OR
- the application and conversion to start were recorded on a single POT, and there is a record in M32$_WEB_USERCHANGES of the contractor ID being changed on that POT from an applicant contractor to a non-applicant contractor.
Applications Converted to Starts by Month
Shows the number of applicants each month who subsequently became a full starter on a non-applicant contractor. The month in which the learner is counted is determined by the POT start date of the original application, not the conversion to a start.
An applicant is considered to have converted to a start if:
-
they have another POT on a non-applicant contractor where the POT start date is greater than the POT termination date of the applicant POT
OR
- the application and conversion to start were recorded on a single POT, and there is a record in M32$_WEB_USERCHANGES of the contractor ID being changed on that POT from an applicant contractor to a non-applicant contractor.

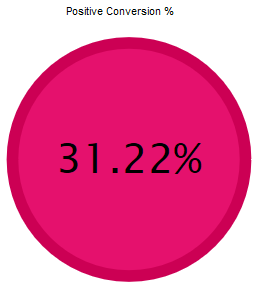
Positive Conversion %
Shows the percentage of applicants over the selected time period (year to date or a rolling 12 month period) who subsequently became a full starter on a non-applicant contractor.
By default, 0 to 33% will show red, 33 to 66% will show amber and 66 to 100% will show green. Information on how to configure these targets can be found here.
An applicant is considered to have converted to a start if:
-
they have another POT on a non-applicant contractor where the POT start date is greater than the POT termination date of the applicant POT
OR
- the application and conversion to start were recorded on a single POT, and there is a record in M32$_WEB_USERCHANGES of the contractor ID being changed on that POT from an applicant contractor to a non-applicant contractor.
