Business KPIs
The Business KPIs dashboard shows the same data as the Business Health Check dashboard, presented in a different way.
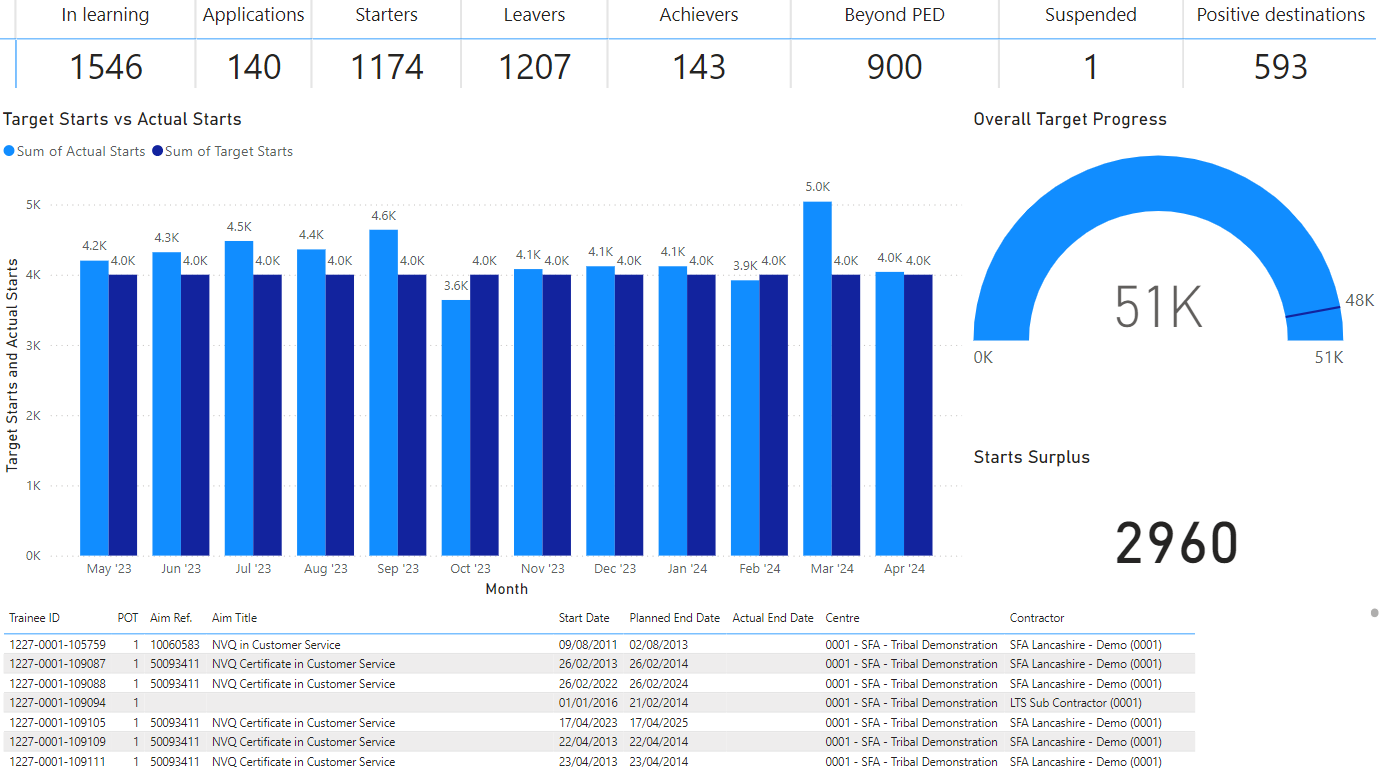
Current Figures
Shows a summary of key figures from the past rolling 12 months.
The 12 month timeframe is defined as the last full 12 months - i.e. not including the current month. For example, if the current month was June 2024, the timeframe would cover 1st June 2023 to 31st May 2024.
-
In learning - The number of learners currently in learning, determined by the POT termination date not being entered.
-
Applications - The number of learners on applicant contractors where the POT start date was within the past 12 months. Note that other figures on the dashboard exclude applicants.
-
Starters - The number of learners where the POT start date was within the past 12 months.
-
Leavers - The number of learners where the POT termination date was within the past 12 months.
-
Achievers - The number of learners where the POT termination date was within the past 12 months and the learner has achieved.
-
For ILR learners, achievement is counted as when the programme or main aim completion status is 2 (completed) and the programme or main aim outcome is 1 (achieved).
-
For LLWR learners, achievement is counted as when an award is present for the POT with an award reference of LDKKFRAM.
-
-
Beyond PED - The number of learners currently in learning where the planned / expected end date is in the past. This uses TRAINEEPOT.FUNDINGEXPIRYDATE04 for ILR learners (i.e. the main aim planned end date) and TRAINEEPOT.EXPCOMPLETIONDATE for LLWR learners (i.e. LP77 Expected Programme End Date).
-
Suspended - The number of learners currently on suspension or a planned break.
-
For ILR learners, this is where the programme or main aim completion status is 6 (temporary withdrawal).
-
For LLWR learners, this is where the learner has at least one activity in the POT with an LA31 Completion Status of 5 (suspended learning).
-
-
Positive destinations - The number of learners who have a destinations record with a collection date after the POT termination date and an outcome type of EDU, EMP, GAP or VOL.

Targets vs Actual Starts
Shows the targeted number of learners to start each month compared to the actual number of learners who started.
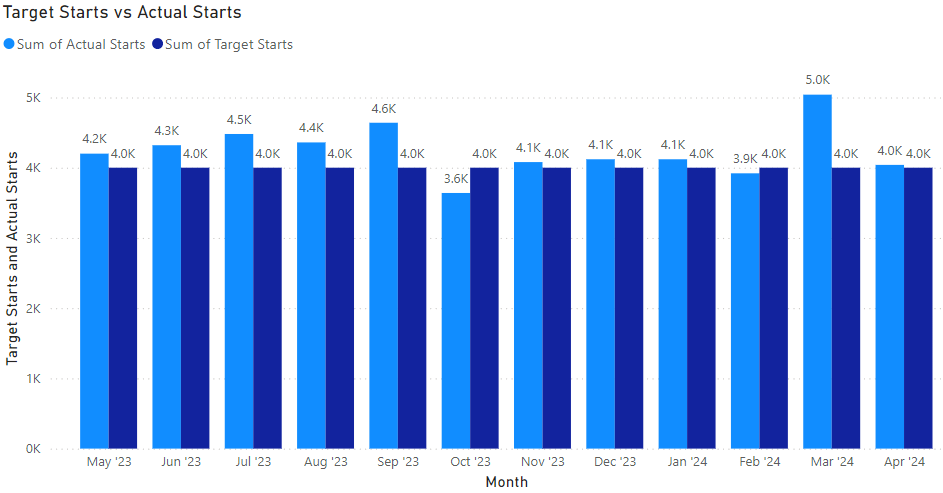
Target starts are stored in the BI2_STARTTARGETS table and can be entered in Maytas 5 for each month and contractor. First, a tab must be imported:
-
In Maytas, go to Tools on the toolbar and click Import on the Screens panel of the ribbon.
-
Click Browse.
-
Browse to the Maytas\Extras\Tabs folder of the latest Maytas upgrade.
-
Select the BI Start Targets.m5tab package and click Open.
-
Click Next, then click Finish.
-
Go to Home on the toolbar and click Sync.
Target starts can then be entered as follows:
-
In Maytas, go to Management on the toolbar and click Contracts on the Finance panel of the ribbon.
-
On the left, select the contractor you wish to enter target starts for.
-
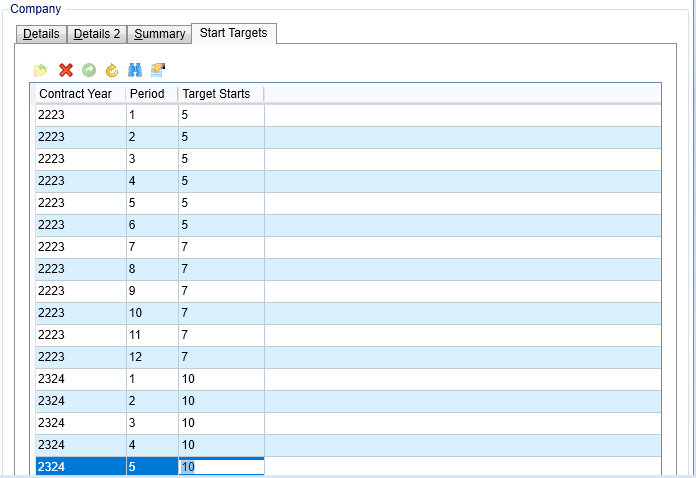
On the right, select the Start Targets tab.
-
Double-click a cell in the Target Starts column to edit the number for each row as required.
-
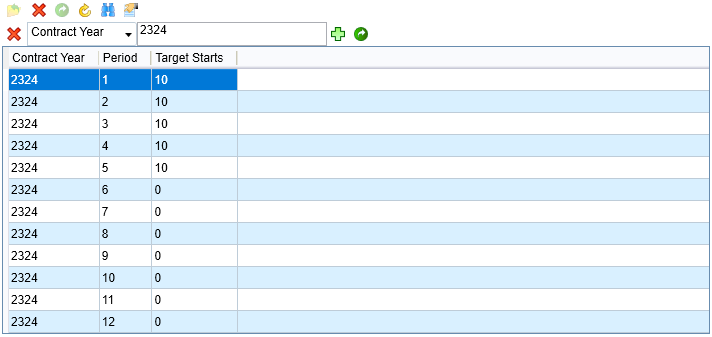
You can filter the rows displayed by clicking the
 button. This will display a dropdown box where you can choose the column to filter by and a text box where you can enter the value to filter by.
Click the
 button to apply the filter.
-
Click Apply when finished.
Overall Target Progress
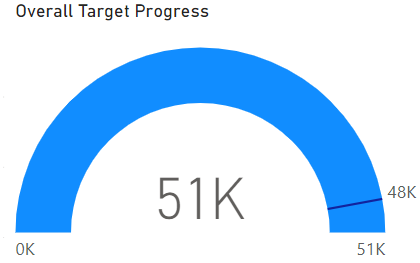
Shows the sum of actual starts compared to the sum of target starts over the past 12 months.
In the image below, the target is indicated by the black line at 48K and the actual starts are shown by the blue bar (51K).
If the actual starts are less than the target starts, the target will be the far extremity and the actual starts will show the blue bar relative to that.
Starts Surplus
Shows the surplus or deficit of actual starts compared to target starts over the past 12 months.

Details Table
Shows the breakdown of learners used on the dashboard. Clicking on a figure in one of the other charts will filter the table by the relevant learners.
Note that clicking target starts will not display any learners in the table, as targets do not represent any actual learners.
