Create a Report Using the Wizard
- In Maytas 5, click the M5 logo at the top left of the screen.
- Select New | Report.
- The report wizard will be displayed. Enter the following details:
- Report Name – The name to be displayed for the report.
Category – The report category (e.g. Learner, Assessor, Employer, etc). You can either enter a new category or choose an existing category from the dropdown box.
Additional options can be displayed by clicking More Options:
- Sub Category – A sub category can optionally be entered to allow for more precise categorisation.
- Orientation – Reports can be shown in portrait or landscape.
- Page Title – The title which will be displayed at the top of each page.
- Page footer – This will be shown at the bottom of each page.
- Line Spacing – The top slider determines the spacing between each row.
Font Size – The bottom slider sets the size of the font.
All the above details can be modified once the report has been created. Click Next when ready.
- Click Wizard.
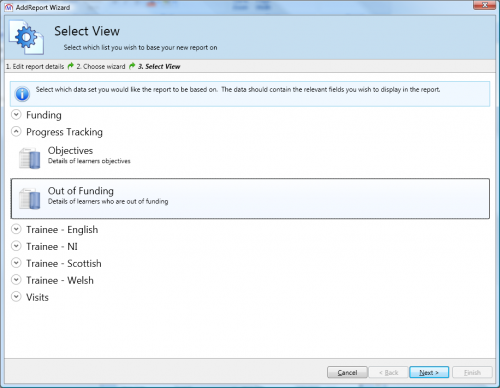
- You will be presented with a list of report categories to choose from, such as Funding, Progress Tracking and Visits. Click the arrow next to a category to expand it and show the data sets.
-
Each data set forms the basis of a report and contains all standard fields relevant to the selected category, without the need for setting up table joins. For example, if you want a report to show learners who are out of funding, expand the Progress Tracking category and select the Out of Funding data set.

- Click Next once you have chosen a data set.
-
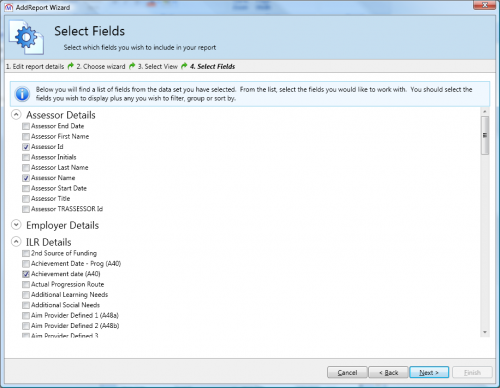
Next you can select the fields to be shown on the report. These are grouped by category (e.g. assessor, employer, trainee basic details, etc). The available fields are relevant to the selected data set.
Click the arrow next to a category to expand it and show the fields within it. Check the box next to each field you want to either display, group by, sort by or add criteria to on the report.

- Click Next when you have chosen all the required fields.
-
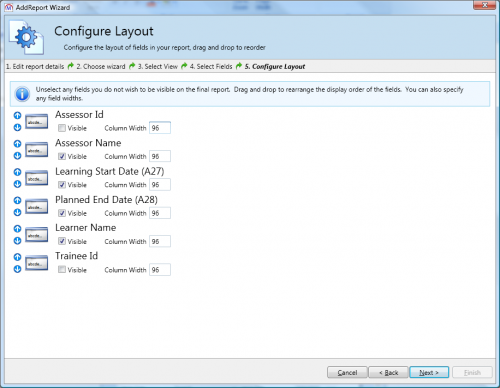
The next screen lets you set the order of fields and which fields you want to actually show on the report.
To change the order of fields, simply drag and drop them into place. You can also select a field and click the up/down arrows to the left.
By default, all the fields will be set to be visible in the report. To hide a field in the report, un-check the Visible box. You can also set the column width for each field.

- Click Next.
- The next screen lets you add any filters you require to the selected fields. Click Edit Filters under the field you wish to add a filter to.
- Criteria can be added as follows:
- Click the
 button and select the entry that is added.
 - Select the required type of criteria from the Function dropdown box.
- Choose the comparison source from the From dropdown box. There are four options:
- None – This is intended for types of criteria which do not require the field to be compared with another value. For example, Empty simply checks whether or not the field is empty.
- Criteria – This is used when you wish to compare the field to a fixed value. Once selected, a box will appear for you to enter the fixed value.
- Parameter – This is used when you wish to compare the field to a value specified in a parameter when the report is run. Once selected, a box will appear for you to enter the name of the parameter. You will then see the parameter when the report is run.
- Field – This is used to compare the field to another field.
- Click OK when finished.
- Click the
- Add additional criteria as required and click OK when finished.
- Click Next.
-
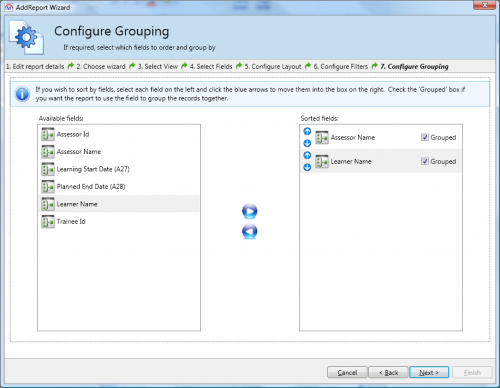
To sort and group by fields, select the field on the left and click the right arrow. This will move the field to the right side of the screen. If you are sorting by several fields you can adjust the sort order by dragging and dropping the fields into place on the right side. If you also want to group by a field, check the Grouped box next to the field on the right.

- Click Next.
- Select the theme you want to use for the report and click Next.
- Click Finish to create the report.
You will now see the standard report design screen. Having used the report wizard, the report should be ready to run at this point. Please refer to the Report Designer Overview for information how to make any amendments.