Report Generator
Maytas 5 Report Generator allows you to create your own reports which can be run from the reports library. This page details the key features of Report Generator and how to use them.
Definitions
The following terminology is used throughout this page. It is recommended that you familiarise yourself with these terms before continuing.
Table
A table is a collection of fields within a specific area of the database, such as learners, employers, claims or invoices. Using a separate table for each area means that the data is only stored once, which makes the database more efficient and reduces data-entry errors. In Report Generator, selecting a table will list the fields within it for use in the report. If fields from more than one table are required, you can join from one table to another.
Table Joins
See the Report Table Joins page for full details.
Tables are joined by fields which are unique for each row of both tables. For example, each learner has a learner ID which is unique to them, and so tables with learner data can be joined via this field. Report Generator handles this in the background, which means all you need to choose is which table you wish to join to.
Report Generator lets you choose different ways to join two tables, allowing for advanced and efficient reporting.
Filters
Conditions can be specified for each field in the report to filter data. For example, using the Begins with function on the learner surname field would allow you to only show learners whose surname begins with a particular letter (or letters).
Parameters
Parameters are options that you can choose before running a report to filter data. For example, a parameter can be added to let you choose a specific learner to run a report for.
Create a Report
There are two ways to create a report:
The report wizard, which lets you choose a series of options to produce the report. The report can be manually amended if required after the wizard has finished. Details can be found in the Create a Report Using the Wizard tutorial.
Manual report creation, where are all fields are added and configured from scratch. This is intended for more experienced Maytas users and allows for advanced report design. Details can be found in the Create a Report Using the Manual Method tutorial.
Report Designer Overview

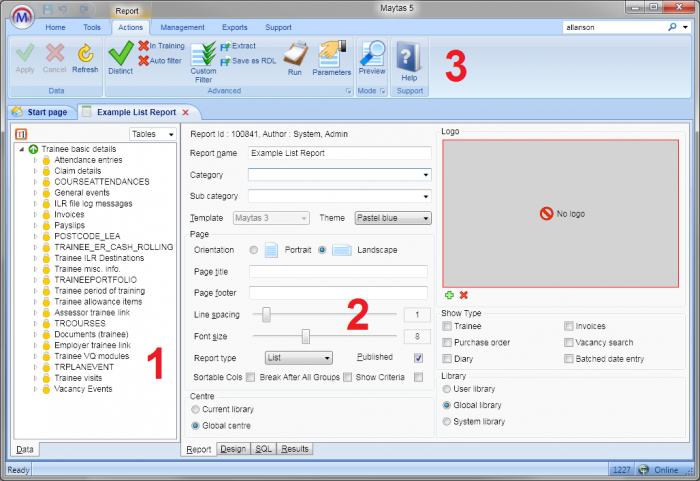
1 – Table List
This is the list of available tables for use in the report. The top table (Trainee basic details in the example above) is the master table that was chosen when creating the report. Note the  icon next to the table, which means it is selected and fields from that table can be added to the report. The tables in the tree view below it can be joined, allowing their fields to be used as well. Information on how to join a table can be found in the Joining a Table section.
2 – Design Area
This is where the report is designed. There are four tabs at the bottom of this area:
- Report – This lets you edit the details of the report (shown above). You can also add a logo to the report on this tab.
- Design – This is where fields are added to the report and configured.
- SQL – This shows the SQL script which has been generated to retrieve the data for the report.
- Results – This shows the raw data which will be returned by the script.
3 – Reports Generator Ribbon
The ribbon for Report Generator has a number of useful features:
- Apply / Cancel / Refresh - These let you save changes, cancel changes or refresh the report.
-
Distinct – By default, reports are set to show only distinct rows (indicated by the green tick). This means that if the SQL returns more than one row with the same data, each unique row will only be shown once. Switching the distinct option off will show all data, including any duplicate rows.
If you have duplicate rows, the best solution is not always to use distinct. Duplicate rows can usually be suppressed by filtering data with criteria to make the report more specific to your needs and give a more accurate representation of your data. This will also make reports more efficient, as distinct has to select the duplicate data then remove it from the report, whereas having the right criteria will only have to select the correct data.
- In Training - When ticked, the report will only show learners who were in training at any point between the analysis date parameters.
- Auto Filter - When ticked, the report will only include trainee-assessor and trainee-employer records that are/were active on the Analysis To date. Please note that this is only relevant if the Assessor trainee link or Employer trainee link tables are joined in the report.
-
Custom Filter – This allows you to enter custom SQL statements to filter data. Please note that this is intended for advanced users with knowledge of SQL scripting, and it is beyond the scope of this document to detail how to write SQL statements.
The custom filter window shows the current SQL on the left, and the area on the right is where the custom filter should be entered. If you have been provided a custom filter by our support team, copy and paste it into the right-hand area (if there is already text present on the right then please contact support, as the provided filter may need amending). When finished, click Apply.
- Extract – This allows you to extract the raw data produced by the SQL and extract it to Microsoft Excel in either XLS or CSV format.
- Save as RDL - This allows you to save the report as an RDL file. This allows reports to be edited in Microsoft Business Intelligence Development Studio (please note that Tribal do not support report writing in BIDS).
- Set up Auto Contact - See here for details.
- Views - See here for details.
- Run – This runs the report.
- Parameters - This allows you to set the values of any parameters before the report is run.
- Preview – This gives a print preview of the report.
Additional Features
Report Properties
The Report tab at the bottom of the report designer lets you alter the basic properties of the report.
See Report Properties for further details.
Table Joins
The list of tables is shown on the left side of the screen. To use fields from more than just the master table you have selected, you will need to join to other tables.
See Table Joins for further details.
Adding Fields to a Report
Once the appropriate tables have been joined, fields can be added to a report:
-
 Click the dropdown list above the table joins section.
 - There are options to show only tables, only fields, or both. Select Fields for this example.
-
You will now see a list of fields on the left, ordered by the table name and field name.
To view the names as they are stored in the database, rather than their display names, click the
 button.
To search for a particular field, click the
 button and enter the field name (both the display name and the field name in the database will work).
 - To add a field to the report, first click the Design tab at the bottom of the screen.
-
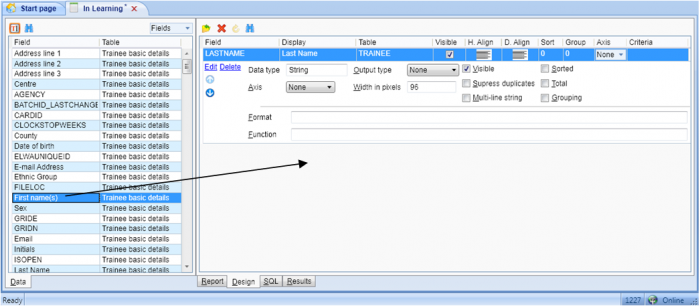
Drag a field from the list to the design area (indicated by the arrow below). Additional fields can be dragged to the design area as required.

- To change the order of fields in the report, simply drag and drop them into place. You can also select a field and then use the up and down arrows to the left of it.
Configuring Fields
There are many configurable options for fields which allow you to tailor reports to your needs.
See Configuring Report Fields for further details.
Summary Reports
Summary reports (also referred to as matrix reports) show a count or a total of data by row groupings and column groupings, similar to a pivot table.
See Summary Reports for further details.
Using Custom SQL Functions
Custom SQL functions can be used to manipulate report data in advanced ways. This is most useful in situations where your data requirements are too complex to be achieved with the standard criteria. Please note that this requires a basic understanding of SQL.
See Custom Report SQL Functions for further details.
See List of Custom Report Functions for an extensive list of available custom functions.
How to Change Field Labels
If field names are displaying with a 'technical' label rather than a user-friendly label (e.g. SERIALNUMBER instead of Learner Reference Number), this can be rectified by following the How to change field and table labels in Report Generator guide.
Export / Import a Report
Report Generator reports can be exported to a .m5rdx file which can be imported into another Maytas system. Note that the standard Reports Library reports and other Reporting Services reports created outside of Report Generator cannot be exported in this way.
-
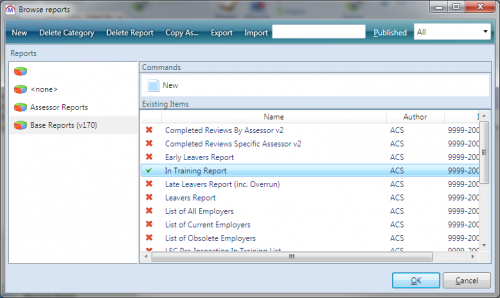
Go to Home on the toolbar and click Edit on the Reports panel of the ribbon.

- Select the report category on the left and then select the report to export on the right.
- Click Export.
- Choose where to save the report, enter a filename and click Save.
- Reports that have been exported to .m5rdx can be imported on this screen by clicking the Import button. Click OK when finished.
Delete a Report
To delete a report:
- Go to Home on the toolbar and click Edit on the Reports panel of the ribbon.
- Browse to and select the report to delete.
- Click Delete Report.
- Click OK to confirm deletion.
- Click Cancel to close the reports window.
Auto-Communication
The Reports Centre allows you to schedule a report which will automatically send an email or SMS to a list of learners, assessors or employers in the report. This is done by creating a mail merge report in Report Generator, configuring it for auto-contact and then deploying it in the Reports Centre.
See here for details.
Report Generator Function to Remove HTML Formatting
Report Generator has a function which can prevent the HTML formatting on a notes field from displaying in a report. This requires a permission to be set:
-
Go to Tools | Edit Permissions.
-
Select the user or group which requires permission.
-
Go to the Commands tab.
-
Expand the Reports section.
-
Set the Edit Custom Filter and expressions permission to Visible.
-
Click Apply and restart Maytas for the change to take effect.
To prevent HTML formatting from displaying for a field in a report:
-
Go to Home on the toolbar and click Edit on the Reports panel of the ribbon.
-
Open the report you wish to edit.
-
Select the notes field (for this example we will use VISITS.NOTES).
-
Set the Output type to Custom.
-
In the Function box, enter:
Maytas3.F_STRIPHTML(fieldname)where fieldname is the name of the notes field.

-
Click Apply.
Any HTML formatting on the notes field will no longer be displayed when the report is run.
Publish Custom Views to Maytas API
Custom SQL views created via Report Generator can be published for use in the Maytas API. This must first be enabled via a permission:
-
Go to Tools | Edit Permissions.
-
Select the user or group that requires permission.
-
Go to the Commands tab.
-
Expand the Reports section.
-
Locate the permission Create and API view from a report and ensure the visibility is set to Visible.
-
Click Apply and restart Maytas for the change to take effect.
To create a custom view from a report:
-
Go to Home on the toolbar and click Edit on the Reports panel of the ribbon.
-
Open the report you wish to use or create a new report.
-
On the Actions toolbar, go to Views | Create API view.

-
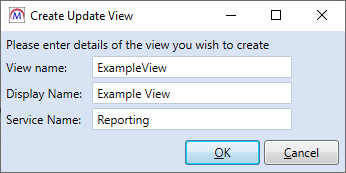
Enter a name for the view (this cannot include any spaces) and the display name. The service name should be left as Reporting unless otherwise instructed.
-
Click OK.
-
Click Apply. You will be notified that there is a Maytas API view associated with the report - click Yes to update the view.
The view will now be available in the API, based on the SQL from the report.
When a view is created from a report, a performance check is run against the view. If the view takes longer than 10 seconds to run, you will be notified that it has failed the performance check and it will not be added to the API.