Financial Planning
The Financial Planning module requires a licence – please contact your account manager for more information.
The Financial Planning module is a suite of tools for producing ESFA financial forecasts and “what if” scenarios to help you plan your financial goals and expected provision requirements for future years. Plans are created against a contract and allow you to quickly and easily experiment with scenarios to see what effect they would have.
Plans can also be used as the basis for profiling so that performance can be measured against it. The plan can then be modelled to see what would happen if things don't go as expected (e.g. a sudden increase or decrease in learner intake).
Each financial plan uses a combination of hypothetical (or 'what-if') figures and actual financial figures. Currently, only figures for funding model 35 (adult skills funding) and 36 (apprenticeships) are calculated for what-if figures, whereas the actual figures include all ESFA funding in Maytas. There are options to view only actual figures, only what-if figures or both merged together.
Before the Financial Planning module can be used, an admin user must enable it:
- Go to Tools | Edit Permissions.
- Select the user or group that requires permission.
- On the Modules tab, set the dropdown box for Financial Planning Module to Visible.
- Click Apply.
Once enabled, the module can be accessed by clicking Financial Plans on the Management toolbar.

Overview
Create a New Plan
To create a new financial plan:
- Go to Management | Financial Plans.
-
Double-click New Financial Plan.
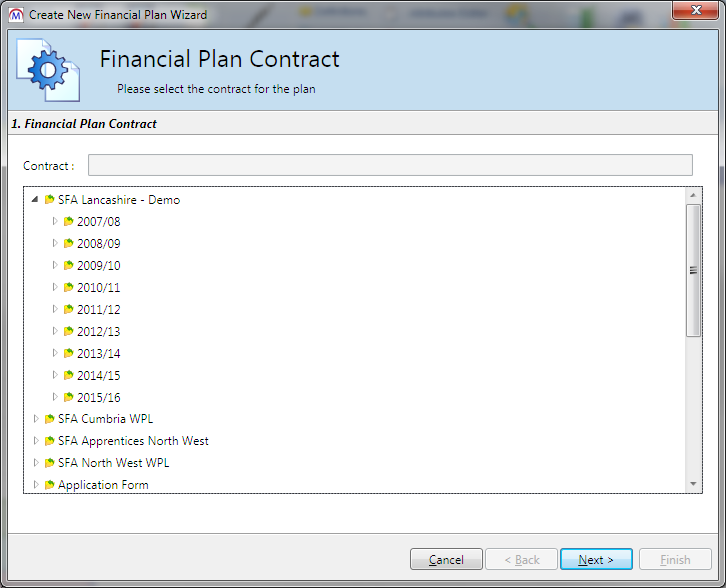
- Expand a contractor and select the contract on which the financial plan will be based.
- Click Next.
- Enter a name for the plan. You can also optionally select a type of plan (ESFA or other) and give the plan a version number, reference and variation date.
-
Click Next.
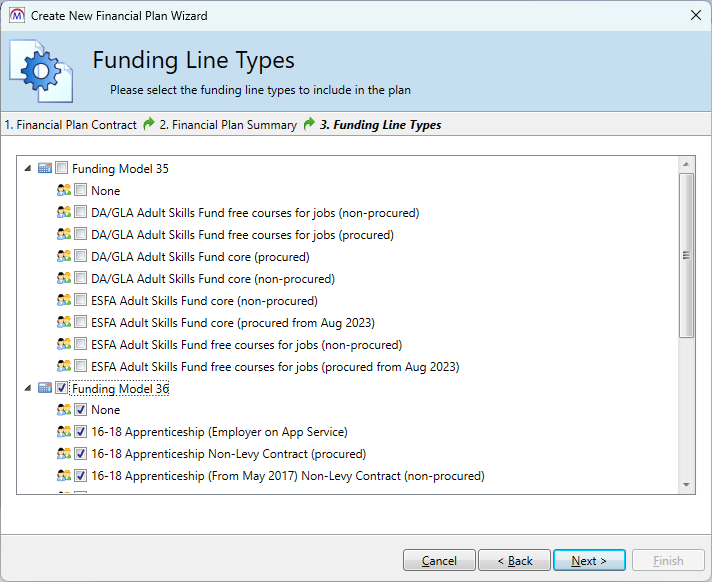
-
On this screen you can choose the funding models and funding line types to include in the plan, which can be a combination of FM35 and FM36. Click Next.
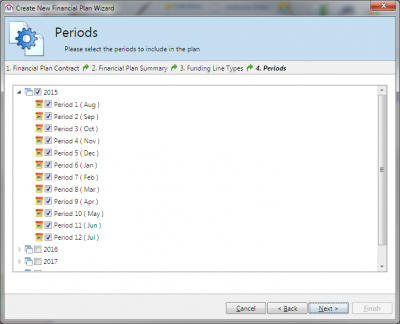
- Select the years and periods to be included in the plan (this determines how far forward the plan will forecast, with a maximum of four years into the future). Please note that the selected periods must be sequential. Click Next when finished.
- Click Finish.
Tabs Summary
There are eight standard financial plan tabs:
- Plan Summary – This displays the plan name, type, contract, version, reference and variation date.
- Notes – This lets you enter any notes about the plan.
- Default Assumptions – This displays a list of assumed modifiers which are applied to the forecasts (area cost, disadvantage uplift, etc). Changing these figures will change the default assumed modifiers for all forecasts in the plan.
- Cohort Groups – Cohort groups are specific types of provision used in the plan (16-18 Apprenticeships, 19-24 Traineeships, WPL, etc). Each group can be given modifiers which override the default assumptions, and aim rates for each aim type can be altered. You can also add and define your own cohort groups.
- Current Data Values – This displays the actual, current financial figures (i.e. not forecasted).
- What If Volumes – This is where you enter the proposed number of learner starts for each year, quarter or period in the plan. These learner volumes are then used to calculate the forecasted finance.
- What If Values – This displays the forecasted financial figures based on the “what if” volumes.
- Total Plan Values – This combines the current data values and the what if values to show the total actual and forecasted financial figures.
Tab Details
Plan Summary
The Plan Summary tab shows basic details about the plan.
- Name - The name of the plan.
- Type - The type of plan (ESFA or other).
- Contract - The contract on which the plan is based.
- Contract Year - The year of the contract, which is used for the first year of the plan.
- Version - This can be used to give a plan a version number (i.e. if there will be multiple versions of the same plan).
- Reference - This can be used to give a plan a reference number.
- Variation Date - If you have created multiple variations of the same plan, this can be used to give a date to each variation.
-
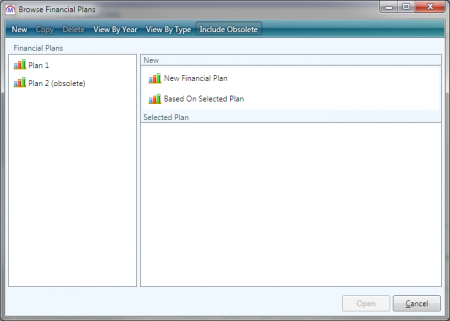
Is Obsolete - Tick this box to make a plan obsolete so that it no longer appears in the list of available plans (i.e. when you go to Management | Financial Plans). Obsolete plans can be shown again by clicking Include Obsolete on the header.
Notes
The Notes tab allows you to enter general notes about the plan (e.g. the scenarios it is intended to model).
Default Assumptions
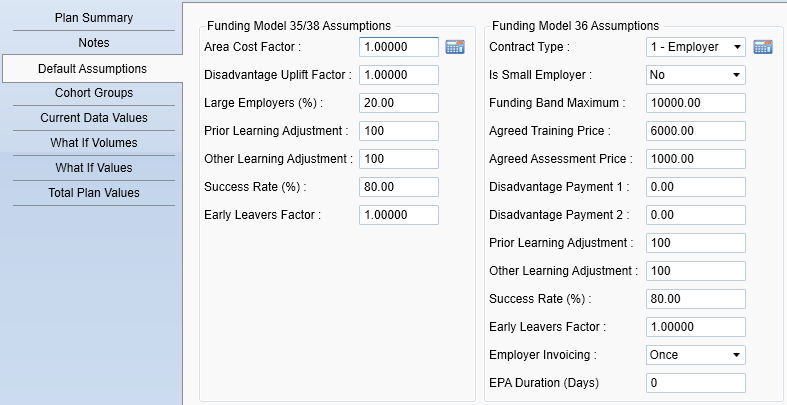
The Default Assumptions tab defines the list of assumed modifiers which will be applied to the plan's forecasted figures. These can be overridden by defining assumptions for specific cohort groups or aims.
For example, the default success rate percentage of 80 means the plan assumes 80% of forecasted starters will achieve. If, however, we went to the Cohort Groups tab and specified that 16-18 Apprenticeships will have a success rate of 60%, the 60% rate would be applied to that particular group (the default of 80% would still be applied to every other group in the plan).
The  button allows you to replace the standard default assumptions with ones calculated from your data instead. The following window will appear:
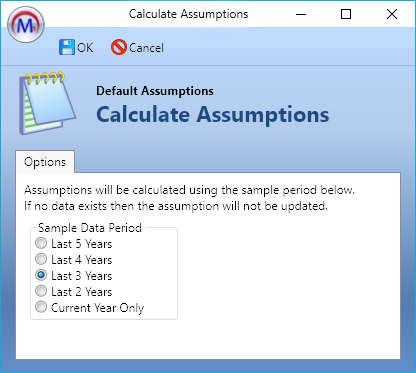
The assumptions will be calculated from a sample of data over the period you select (last 5, 4, 3 or 2 years or the current year only). If no data is available to calculate an assumption, the standard assumption will remain instead. Select an option and click OK.
For information on funding terms and what they mean in terms of funding calculations, please refer to the ESFA's published funding documentation.
Cohort Groups
The Cohort Groups tab defines the rates, durations and assumed modifiers for different types of forecasted provision.

The initial set of cohort groups is determined by the types of provision selected in the wizard when the plan is created. These can be amended or deleted as required, and new cohort groups can be added.
The Field View dropdown box at the top right lets you choose whether to show FM36 assumptions, FM35 assumptions or both.
The assumptions for each group are initially taken from the default assumptions for the plan. These can be edited manually (see below), or they can be calculated per group based on averages from your data. To do this, click the  button. The following window will appear:
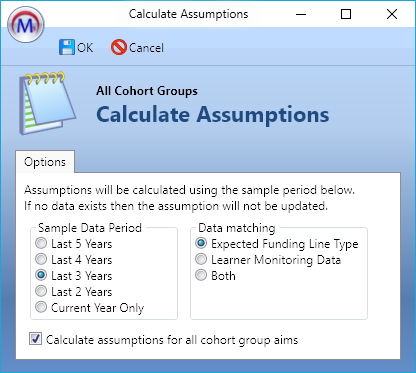
The assumptions will be calculated from a sample of data over the period you select (last 5, 4, 3 or 2 years or the current year only). If no data is available to calculate an assumption, the default assumption will remain instead. If the Calculate assumptions for all cohort group aims box is ticked, the assumptions will be calculated for all of the aims within each group. Select an option and click OK.
To edit a cohort group, select it and click Edit.
To add a cohort group, click the  button.
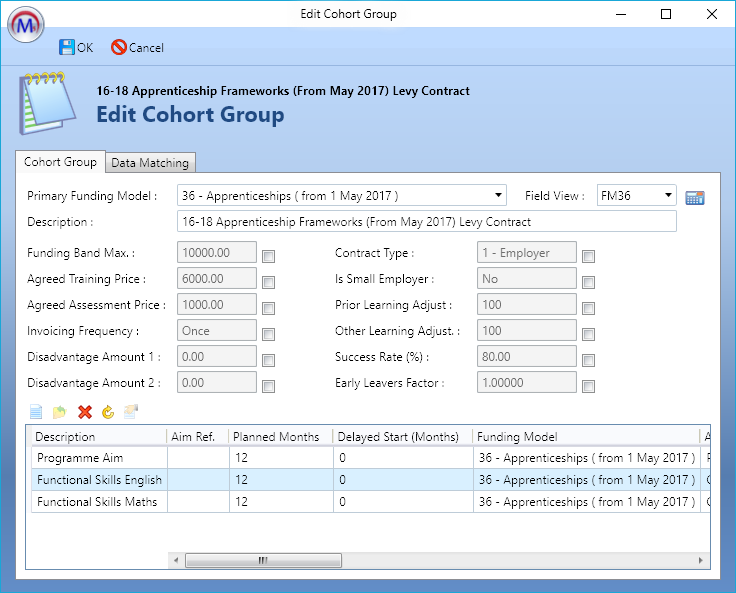
On the Edit Cohort Group screen you can amend the description, set specific assumptions for the group and add / modify the aim rates and other details. You can also toggle between FM35 and FM36 settings using the Field View dropdown box at the top-right.
The assumptions are greyed-out initially and display the default assumptions for the plan. To apply a custom assumption to the group rather than the default, tick the box next to it and edit as required.
The  button can be used to calculate the assumptions based on your data (see above).
The Expected Funding Line box determines which aims will be included when calculating the averages for the assumptions (i.e. only aims with the selected funding line type will be included).

The aims shown at the bottom of the screen are pre-defined in the cohort groups generated by the plan wizard. However, they can be amended or deleted as required, and new aims can be defined for the group. The aims can be defined for specific aim references or can be generic aim templates (e.g. for an Apprenticeship you would have a programme aim and several component aims of various types, but these do not have to map to specific references).
To edit an aim, select it and click Edit.
To add an aim, click the  button.
The Edit Cohort Group Aim Details window has four tabs: Aim Details, Funding Factors, Aim Rates and Type and Specific Aim Details. The intention is that the Aim Details tab should be completed in all cases (Funding Model and Aim Type at minimum) and then you should complete either:
-
Funding Factors and Aim Rates and Type
OR
- Specific Aim Details
This is because Specific Aim Details retrieves aim information from the FIS for a particular aim, and the retrieved information is what would otherwise be entered on the other two tabs. Please note that the fields available on these tabs are different depending on which funding model is selected on the Aim Details tab.
Aim Details
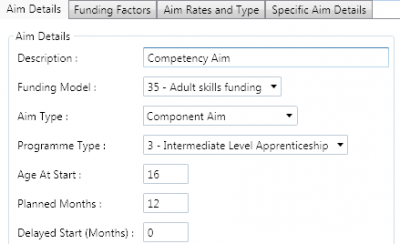
- Description - The description of the aim.
- Funding Model - The funding model of the aim.
- Aim Type - The aim type (Programme aim, component aim, other aim or core aim).
- Programme Type - This should be selected if the aim is part of a programme.
- Age At Start - The age which learners are assumed to be at the start of the aim for forecasting purposes.
- Planned Months - The planned duration in months for the aim.
- Delayed Start (Months) - This will delay the start of the aim a specified number of months after the "what if" volume has been entered. For example, if a volume of 10 is entered in period 1 and the delayed start is 2 months, this aim will be started in period 3 for the 10 learners.
Funding Factors
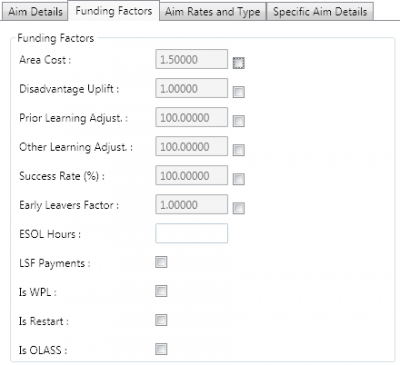
- Area Cost / Disadvantage Uplift / Prior Learning Adjust / Other Learning Adjust / Success Rate (%) / Early Leavers Factor - These assumptions can be overridden by ticking the boxes and editing the values. The new values will then be applied to this aim rather than the assumptions defined on the Edit Cohort Group screen or Default Assumptions screen.
- ESOL Hours - The planned hours in the aim spent on ESOL courses.
- LSF Payments - Tick this if the aim includes LSF payments.
- Is WPL - Tick this if the aim is a WPL aim.
- Is Restart - Tick this if the aim is assumed to be a restart.
- Is OLASS - Tick this if the aim is an OLASS aim.
Aim Rates and Type
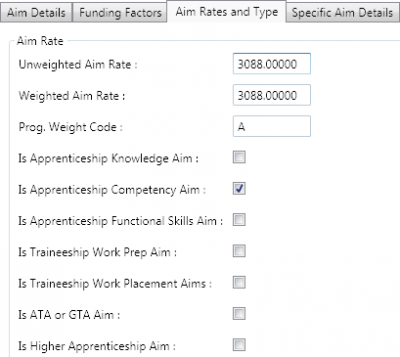
- Unweighted / Weighted Aim Rate - The total value of the aim. The two values are used at different times for various calculations in the FIS. For forecasting purposes, in most cases the two values can be the same. Please refer to the FIS if you wish clarification for specific aim rates.
- Prog. Weight Code - This is only relevant in rare circumstances, and it is recommended that you only change the value if you have a specific requirement to do so.
- Is Apprenticeship Knowledge Aim … Is Traineeship Work Placement Aim - Only one of these five options can be selected at a time. Choose the one that applies to the aim (if any).
- Is ATA or GTA Aim - Tick this if the aim is an ATA or GTA aim.
- Is Higher Apprenticeship Aim - Tick this if the aim is a higher Apprenticeship aim.
- Is Maths/English Aim (FM36 only) - Tick this if the aim is a maths or English aim.
Specific Aim Details
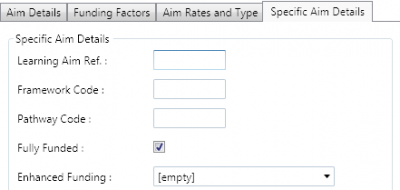
- Learning Aim Ref. - Enter a learning aim reference.
- Framework - If the aim is part of a programme, enter a framework code.
- Pathway Code - Enter an Apprenticeship Pathway code if applicable.
- Fully Funded - Tick this if the aim is fully funded.
- Enhanced Funding - If the aim receives enhanced funding, choose the option from the dropdown box.
- Standard Code (FM36 only) - If the aim is an Apprenticeship standard, enter the standard code.
- EDRS ID (FM36 only) - To link the aim to an employment record, enter the employer's EDRS ID.
Copy cohort groups
New cohort groups can be created by copying an existing group and then editing it as required:
- Go to Management | Financial Plans and open the plan you wish to edit.
-
Go to the Cohort Groups tab.
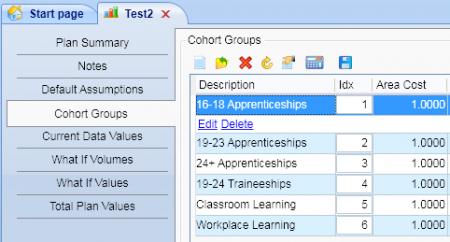
- Select the plan you wish to copy and click the
 button.
 -
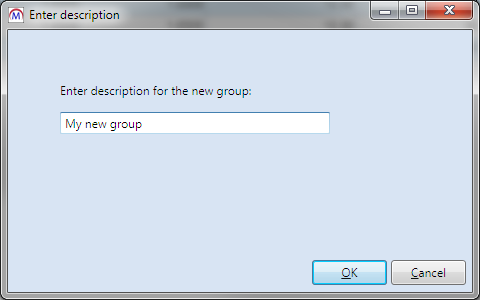
Enter a name for the new group and click OK.
-
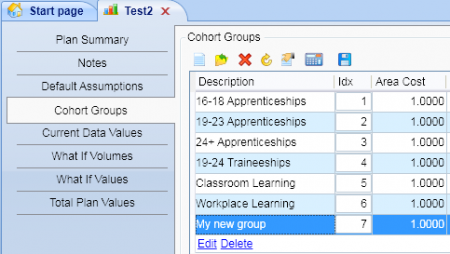
The new group will appear and the list and can be amended as normal. All details from the copied group will be present in the new one.
Manually sort cohort groups
Cohort groups can be manually sorted by entering an index number against them:
- Go to Management | Financial Plans and open the plan you wish to edit.
-
Go to the Cohort Groups tab.
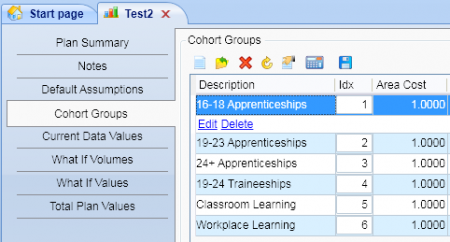
- The Idx column determines the order in which the groups appear (by default this will be alphabetical). Edit the Idx numbers as required to create the new order.
- Click Apply.
- Close and re-open the plan for the new ordering to be appear.
Current Data Values
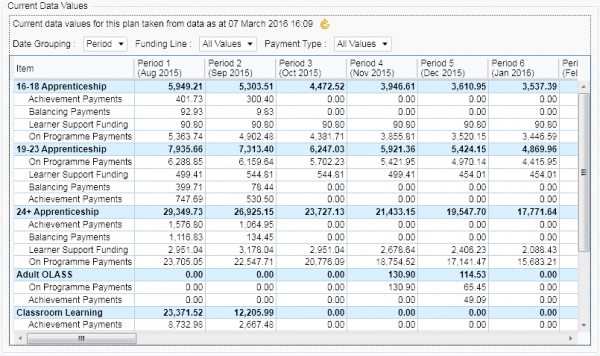
The Current Data Values tab shows the actual ESFA funding figures from Maytas. The first time you view this screen after creating a plan, all the figures will be zero as the data needs refreshing. Click the  button to do this. Once finished, a date and time will appear next to the refresh button, which indicates the date and time that the funding cache was updated, not the time that this screen was refreshed.
There are three filters for displaying data:
- Date Grouping - This lets you display the figures by period, quarter, half year or full year.
- Funding Line - This lets you filter by types of funding provision (e.g. 16-18 Apprenticeships, classroom learning, etc).
- Payment Type - This lets you filter by the payment category (e.g. OPPs, achievement payments, etc).
What If Volumes
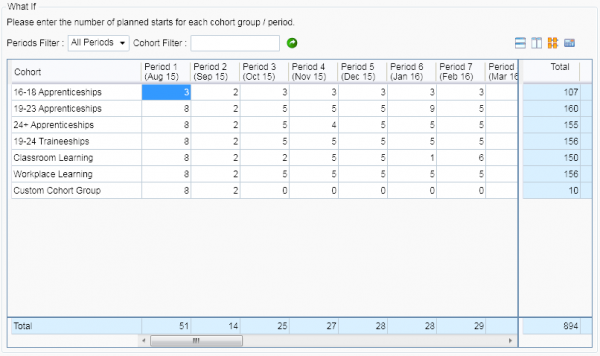
The What If Volumes tab is where you enter the number of learners to forecast. The period in which you enter a volume is the period in which those learners will be forecasted to start, and subsequent periods will forecast OPP payments, achievements, etc, as defined in each cohort group. For example, if you entered a volume of 5 for every period, that would not indicate that there are 5 learners in learning each period but rather that are 5 starters each period.
To enter a volume, click in the grid, enter the number, click another box and click Apply.
There are four buttons which help with entering volumes in bulk by propagating the volumes across the grid. To use them, click a volume in the grid and then click one of the buttons:
-
 This will fill the entire column with the selected value.
 -
 This will fill the entire row with the selected value.
 -
 This will fill the entire grid with the selected value.
 -
 The flex button is slightly different as it increases or decreases existing values by a percentage. The following window will open:
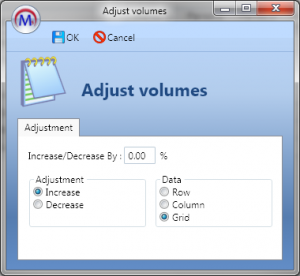
Select whether you wish to increase or decrease the values, select whether you want to change values in the row, column or grid, enter the percentage to increase or decrease by and click OK.
You may wish to only change or propagate volumes for a particular timeframe - e.g. you may wish to change the volumes for only a single year rather than all years in the plan. To do this, use the Periods Filter to choose the timeframe you require.
You can also filter by cohort groups (shown on the left of the grid). To do this, enter the full or partial name of the cohort in the Cohort Filter box and click the  button.
What If Values
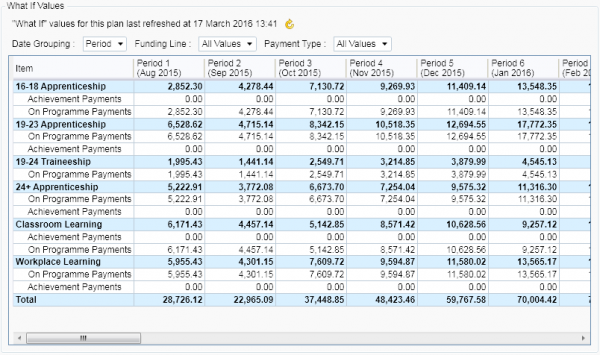
The What If Values tab shows the forecasted financial figures based on the aim details defined in the cohort groups and the volumes entered on the What If Volumes tab. As with the Current Data Values tab, the figures will all be zero the first time you go to this tab after creating a plan as the data must be refreshed. Click the  button to do this. The date that appears next to the button shows the date that this screen was last refreshed. In general it is a good idea to refresh this screen after making changes on the Cohort Groups tab or the What If Volumes tab.
There are three filters for displaying data:
- Date Grouping - This lets you display the figures by period, quarter, half year or full year.
- Funding Line - This lets you filter by types of funding provision (e.g. 16-18 Apprenticeships, classroom learning, etc).
- Payment Type - This lets you filter by the payment category (e.g. OPPs, achievement payments, etc).
Total Plan Values
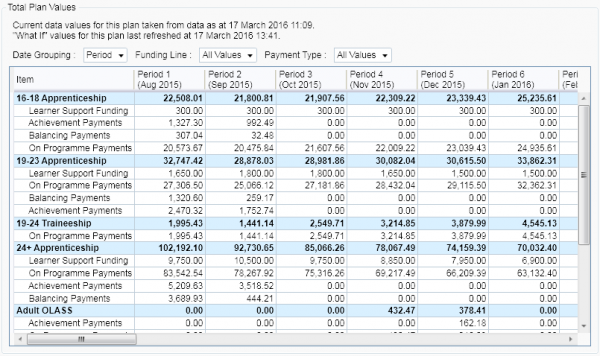
The Total Plan Values tab shows a combination of data from the Current Data Values and What If Values tabs - i.e. the total value of actual and forecasted financial figures. The data on this screen does not need to be manually refreshed as it simply combines the data from the other two values tabs (which do need to be refreshed).
There are three filters for displaying data:
- Date Grouping - This lets you display the figures by period, quarter, half year or full year.
- Funding Line - This lets you filter by types of funding provision (e.g. 16-18 Apprenticeships, classroom learning, etc).
- Payment Type - This lets you filter by the payment category (e.g. OPPs, achievement payments, etc).
Funding Model 36 Notes
Forecast Completion Rate
The forecast completion rate calculation can be found on the Claim Details calculations tab for FM36:
- Open the record for a learner on funding model 36 and go to the Claim Details tab.
-
On the Calculations tab, the forecast completion rate can be found in the framework uplift section.
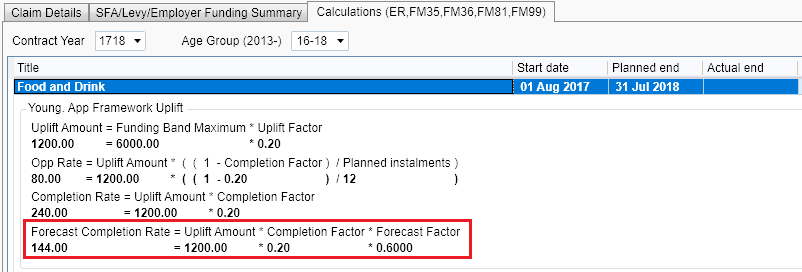
Note that this uses the default forecast factor, which is overridden in financial plans by the success rate assumption value.
Employer Balancing Payments
Employer balancing payments are included in the what-ifs and current values for financial planning for FM36 plans where the funding band maximum is less than the total price (for the what-if values, this is determined in the assumptions where Funding Band Maximum is less than Agreed Training Price + Agreed Assessment Price).
The following assumptions are made for employer balancing payments:
- Invoicing is assumed to be in advance.
- The payments are not invoiced after the actual end date.
- Where there is a residual change in price, the invoicing frequency starts again from the price date.
- Where there is a change in price after the planned payments, a one-off balancing payment may be generated, providing that the actual end date has not been reached.
Example Plans
Basic Forecast
For this example, we will create a basic three year plan using the default assumptions.
- Go to Management | Financial Plans and double-click New Financial Plan.
- For this example we will select a 2015/16 contract for an ESFA contractor, selecting all funding provision types and all periods for 2015, 2016 and 2017.
- Once the wizard has been completed, go to the Current Data Values tab.
-
All values will be at zero. This is because the values need refreshing when a plan is first created. Click the
 button to refresh the current values (click Yes to confirm).
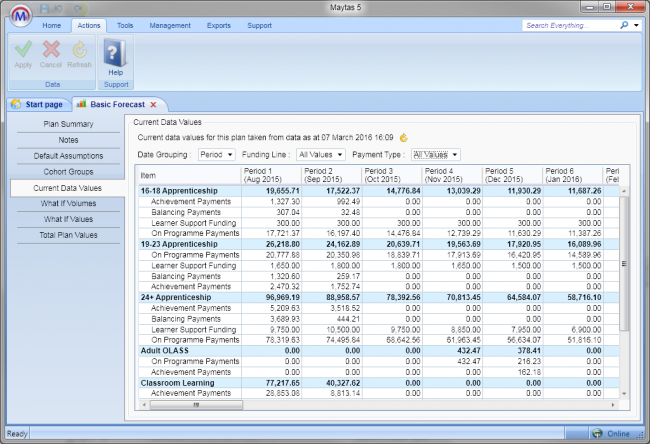
The values are populated from the cached funding information generated by Maytas. The date and time displayed next to the
 button indicates when the funding cache was refreshed, not when the values on this screen were refreshed. The funding cache will be set to periodically refresh out-of-hours on most systems, but it can be manually run by going to Management | Profiles and click the Funding Cache button (on large databases this may take a long time and can slow down the system while running).
 -
Next, go to the What If Volumes tab.
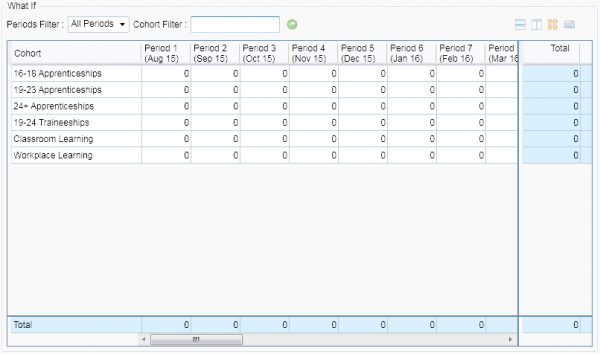
- Enter a number in the top-left box (for this example we will forecast for 5 starters).
- Select the top-left cell and click the
 button to cascade this value across all periods in the plan – i.e. so that there are 5 starters per period and cohort. Click Apply when finished.
 - Go to the What If Values tab.
-
Click the
 button to refresh the forecasted values (click Yes to confirm).
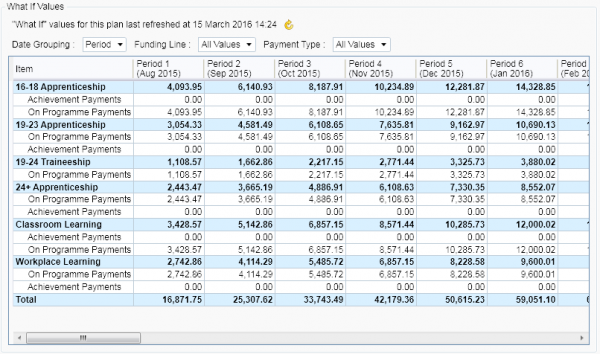
Please note that the date and time next to the
 button refers to when the forecasted values were updated, unlike the Current Data Values tab where it refers to when the funding cache was updated.
 - The combination of current data and forecasted data can now be viewed on the Total Plan Values tab.
Now that a basic plan has been created, we can modify the “what if” values to see what effect this has on the forecast. For this example, we will model the financial impact of learner intake dropping from 5 learners each period/cohort to 3 learners each period/cohort in year 3:
- Go to the What If Volumes tab.
- From the Periods Filter dropdown box, choose Year 3 (2017). This will filter the grid so that it only shows the periods in year 3.
- Enter 3 in the top-left box, then click out of the box and click Apply.
- Select the top-left box and click the
 button to cascade the new value across all periods and cohorts in year 3.
 - Click Apply.
- Go to the What If Values tab. Note that the current total value should be approximately £3m based on the default assumptions and volumes of 5 learners per period/cohort.
- Click the
 button to refresh the results. The total value will drop to approximately £2.7m (the values for each period and cohort will also be updated accordingly).
Modifying Assumptions
Using the plan created in the previous example, we will now model the effect of changing the default assumptions:
-
Open the plan if it is not already open and go to the Default Assumptions tab.
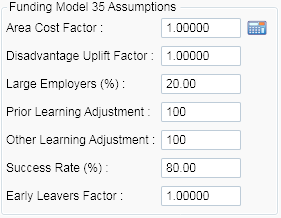
- These are the assumptions that are used across the entire plan unless different assumptions are specified for particular cohort groups. For this example we will change the achievements % to 60. Click out of the box once the figure is changed and click Apply.
- Go to the What If Values tab and click the
 button to refresh the results. The total value will drop from £2.7m to £2.6m.
Modifying the default assumptions offers many forecasting possibilities, such as modelling best and worst case scenarios (i.e. 100% and 0% achievements).
Cohort Groups
Using the plan from the previous examples, we will now modify the cohort groups to model scenarios for specific types of provision, first by overriding the default assumption for the achievement percentage and by seeing the effect of a substantial increase in competency aim rates for 16-18 Apprenticeships:
-
Open the plan if it is not already open and go to the Cohort Groups tab.

-
Select 16-18 Apprenticeships and click Edit.
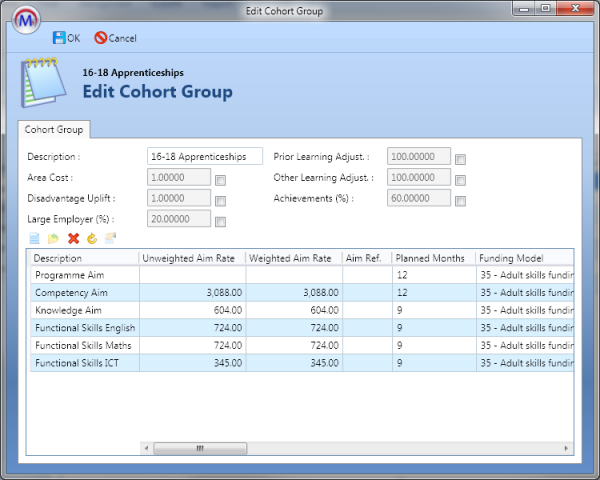
- Here we can see greyed-out assumptions which match the figures from the Default Assumptions tab. These figures can be overridden for the cohort group. Tick the Achievements (%) box and change the value to 100.
- The aim details and rates at the bottom of the screen can also be modified. Select the Competency Aim row and click Edit.
-
Go to the Aim Rates and Type tab.
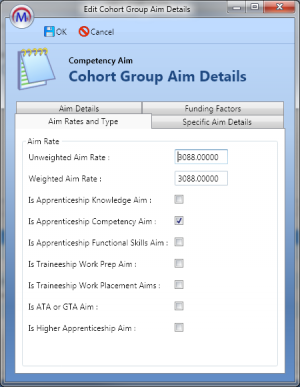
- Change the Unweighted Aim Rate and Weighted Aim Rate to 4088.
- Click OK, then click OK again and click Apply.
Next we will add a custom aim rate to Workplace Learning:
-
On the Cohort Groups tab, select Workplace Learning and click Edit.
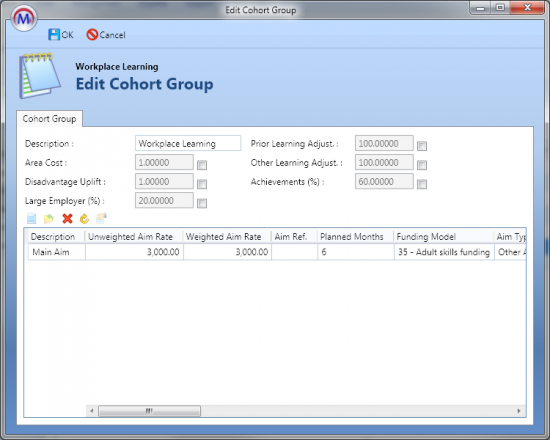
- Currently, Workplace Learning only has a rate for the main aim. For this example we will model the effect of adding a custom aim to this cohort group. Click the
 button.
 - On the Aim Details tab, enter the description as Custom Aim, set the funding model to 35, set the aim type to Other Aim, set the age at start to 19 and set the planned months to 6.
- On the Aim Rates and Type tab, set the unweighted and weighted aim rates to 100.
- On the Funding Factors tab, tick the Is WPL checkbox.
- Click OK, then click OK again and click Apply.
Finally we will add a new cohort group:
- On the Cohort Groups tab, click the
 button.
 - Enter Custom Cohort Group as the description.
- Click the
 button to add a new aim rate.
 - On the Aim Details tab, enter Custom Aim as the description, set the funding model to 35, set the aim type to Other Aim and enter 12 in the planned months box.
-
Go to the Specific Aim Details tab.
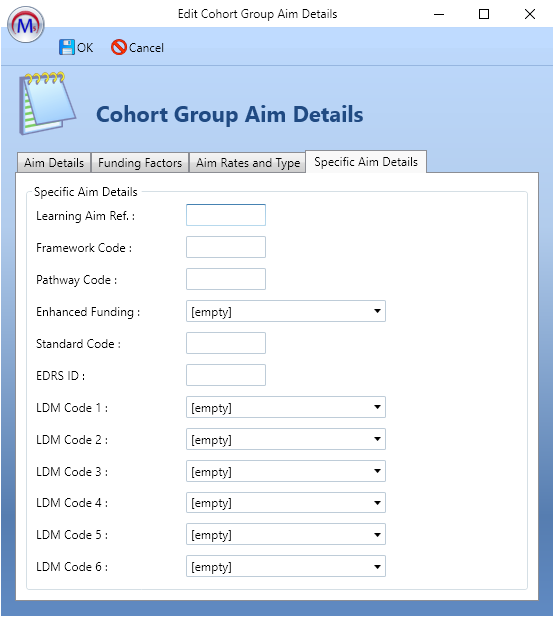
The Specific Aim Details tab allows you to retrieve aim information for a particular aim from the FIS tables.
- Enter 5008818X in the learning aim ref box and tick the Fully Funded checkbox.
- Click OK, click OK again then click Apply.
- Go to the What If Values tab and click the
 button to refresh the results.