Wellbeing
The Learner Wellbeing module provides a simple tool for learners to record feedback on their mood whenever they feel it is appropriate, along with monitoring tools for assessors and managers to help provide learners with additional support as required.
Additionally, a notification tool can be configured to inform users of all types when they have been active in Hub for a specified amount of time, so that they can be reminded to take a break if needed.
Permissions
The Wellbeing widget is displayed by default for learners. To disable it for a learner or group:
-
Go to Web User Editor on the sidebar.
-
Search for and open the user or group that requires permission.
-
Expand the Dashboard Widgets section.
-
Locate the Learner Wellbeing permission and select Always Off.
-
Click Save.
Learner Dashboard
The wellbeing widget is included on the learner dashboard by default.
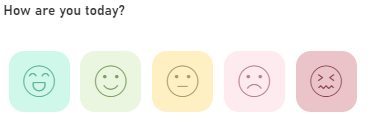
When a learner selects a mood, this is acknowledged with a message.
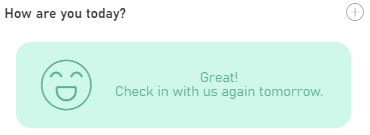
If a learner wishes to add more than one mood for the same day, they can click the  button at the top-right of the widget and choose again (this adds an additional mood entry, rather than replacing the previous one).
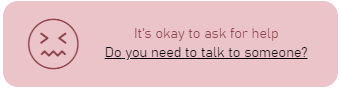
For the two lowest moods, the learner will be asked if they need to talk to someone. Clicking the link will open a new message with their assessor selected as the recipient by default.
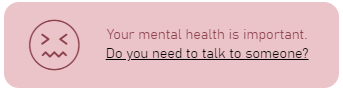
The message displayed for the two lowest moods can be configured - see below for details.
Assessor Dashboard
The wellbeing widget can be viewed for an assessor's personal caseload or for the whole team, by toggling the Team Dashboard button at the top of the home screen.
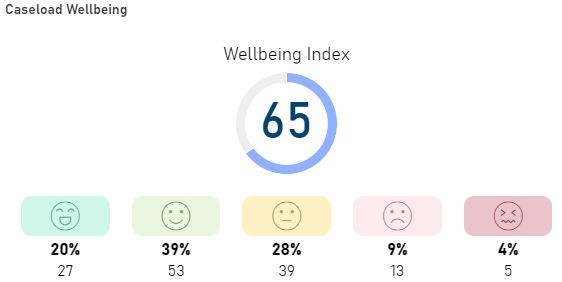
Each mood shows the percentage share and the number of learners who have selected it as their most recent mood. These are collated into the Wellbeing Index, which provides an overall percentage figure for the mood of the caseload(s).
The index is calculated as follows:
-
Each mood is assigned a value: great = 100, good = 75, okay = 50, bad = 25 and terrible = 0.
-
The number of learners for each mood is multiplied by the mood value, then those values are added together. Using the example above, this would be:
(27 x 100) + (53 x 75) + (39 x 50) + (13 x 25) + (5 x 0) = 8950
-
This is divided by the total number of statuses (e.g. 27 + 53 + 39 + 13 + 5 = 137) and then rounded to the nearest whole number. For the above example this would be 8950 / 137 = 65.33, rounded to 65.
-
The full Wellbeing Index calculation for the example is:
( (27 x 100) + (53 x 75) + (39 x 50) + (13 x 25) + (5 x 0) ) / (27 + 53 + 39 + 13 + 5) = 65
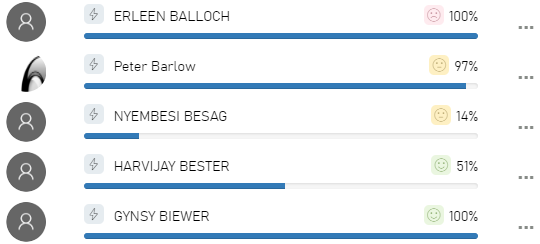
The latest submitted mood for each learner is also visible on the My Learners widget on the assessor dashboard.
Configurable Mood Messages and Break Notifications
When a learner selects a negative mood, the message that is displayed to them can be configured. Additionally, settings can be enabled which will notify users (not only learners) when they have been active in Hub for a specified amount of time and encourage them to take a break.
To set the configuration options:
- In Maytas Hub, go to Settings on the sidebar.
- Click the System configuration button.
- Go to Admin on the left (under the Maytas Hub Online header).
- Locate the Wellbeing section on the right.
- There are three config options. Tick the box for each option you wish to use:
Set a custom Learner Wellbeing message - Enter the text you wish to display when a negative mood is selected (note that the text Do you need to talk to someone? will always appear). If the config is disabled, the default text of Your mental health is important will be displayed.
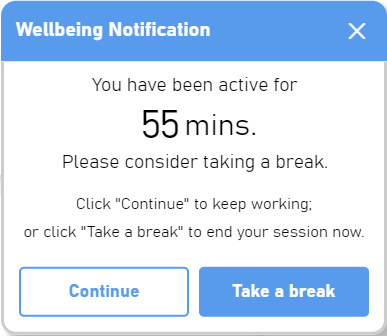
Wellbeing notification body - Enter the text you wish to display when users are notified that they have been using Hub for a specified amount of time. The {TIME} parameter can be used to display the time a user has been active (e.g. You have been using Hub for {TIME} - consider taking a break).
Wellbeing notification trigger time - Enter the time in minutes after which users should be notified how long they have been using Hub.
- Click Save.
If the custom learner wellbeing message is set, learners will see the custom message when they select a negative mood.
If the wellbeing notification options have been set, users will be notified when they have been active in Hub for the specified time. If the user clicks the Continue button, the timer will reset and another notification will be displayed after the specified time interval has elapsed again, showing the total time the user has been active. Clicking Take a break will log the user out.
Wellbeing Screen for Assessor Users
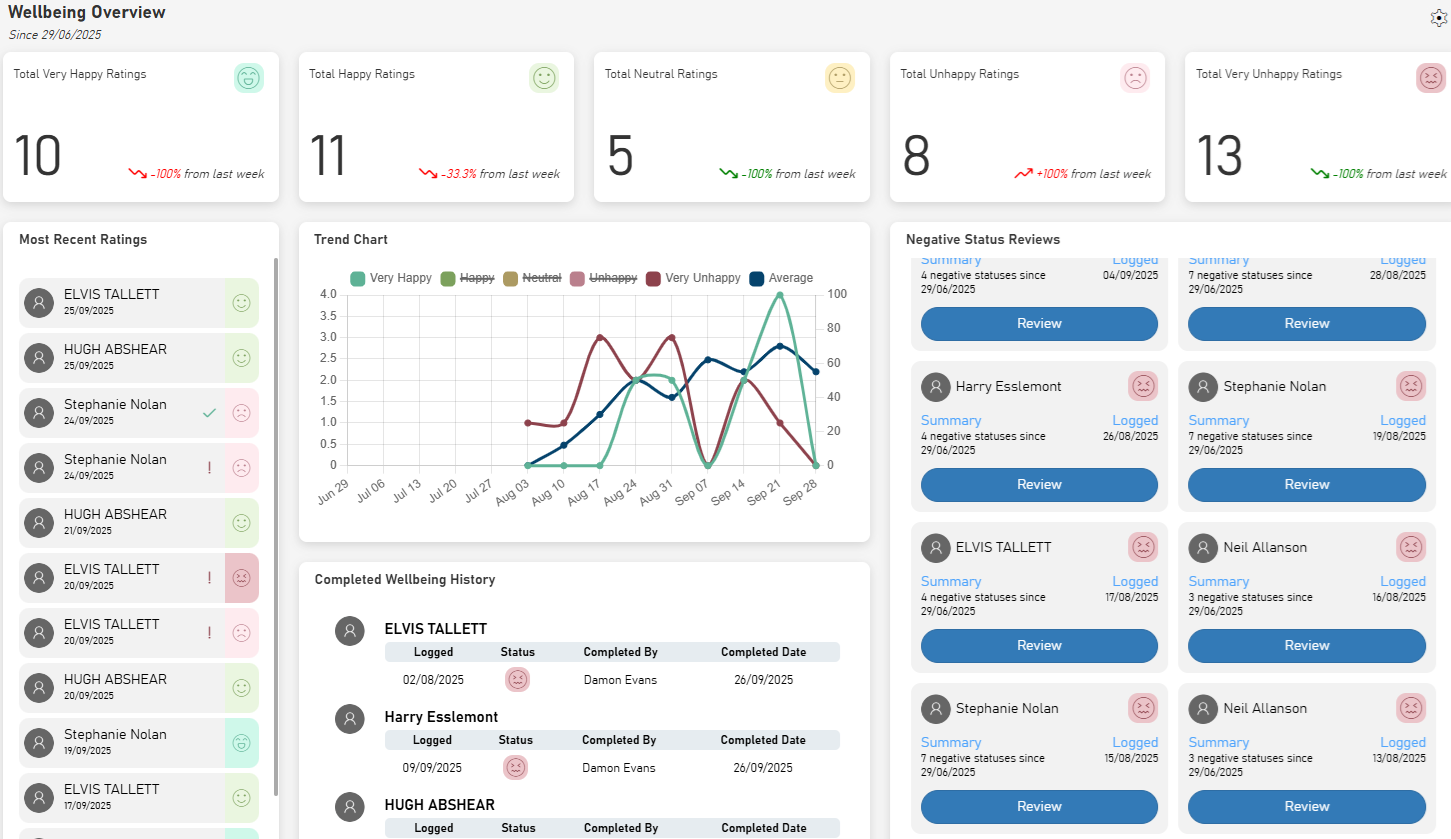
The Wellbeing screen for assessor users shows a summary of learner wellbeing information for an assessor's caseload. It also allows an assessor to review negative statuses submitted by their learners and record any action taken to resolve.
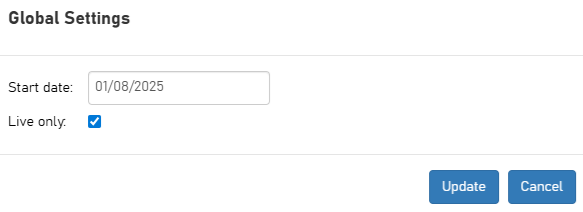
Settings
Settings for the Wellbeing screen can be accessed by clicking the  button at the top-right.
-
Start date will filter statuses that were submitted on or after the selected date.
-
If Live only is ticked, only learners currently in learning will be included in the results. When unticked, learners in the caseload that have ended learning will also be included.
Click the Update button to apply any changes.
Wellbeing Overview
The Wellbeing Overview panel shows how many submissions there have been for each status since the date specified in the settings, along with the weekly percentage trend (up or down) for each status.
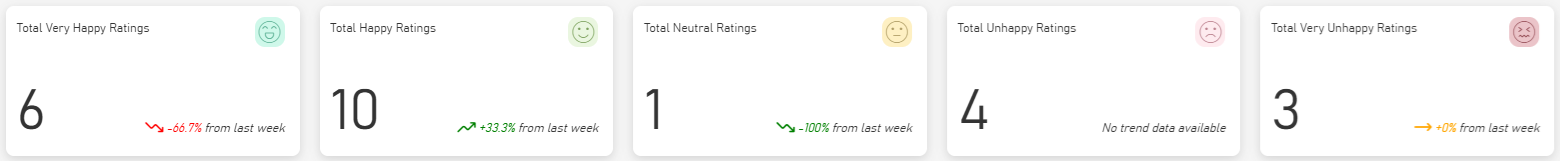
The percentage trend is based on a rolling week, where the number of ratings for a status in the last 7 days are compared to the ratings in the 7 days previous to that. If no data is available from 1 week to 2 weeks ago, the status will show that no trend data is available.
The trend arrow is coloured differently depending on the context:
-
For Happy and Very Happy ratings, the arrow shows green when trending up and red when trending down.
-
For Neutral, Unhappy and Very Unhappy ratings, the arrow shows red when trending up and green when trending down.
-
All statuses show an amber arrow if there is no change.
Most Recent Ratings
The most recently submitted ratings from the assessor's caseload are listed here. Negative statuses that have not been reviewed (see Negative Status Reviews) are listed with a red exclamation mark next to the status.
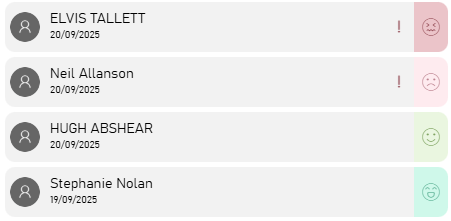
Negative statuses that have been reviewed are listed with a green tick. Hovering the cursor over the tick will show the assessor who reviewed it.
Trend Chart
The trend chart shows ratings over time (week by week) for each status. Clicking a status on the legend at the top of the chart will hide its trend line, and clicking it again will show it.
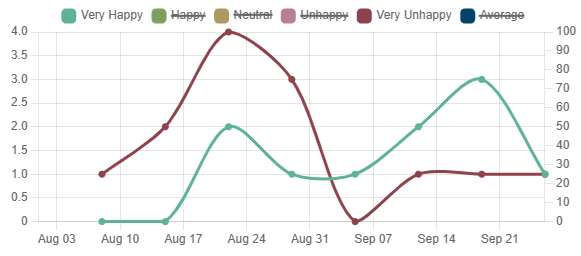
The left axis shows the number of ratings for each week.
The right axis is only relevant to the Average trend line, as it shows an index from 0 to 100 which is the average wellbeing score from all the ratings each week. This is calculated per week using the same logic as the overall wellbeing index shown on the assessor homepage (the only difference being that rather using each learner's most recent rating, it uses all the ratings from that week).
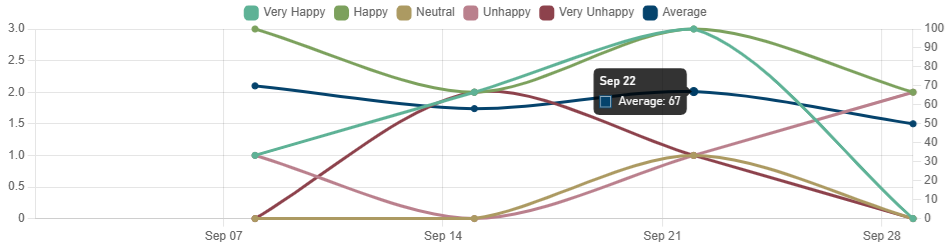
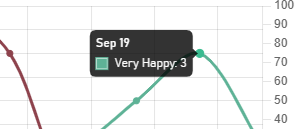
Hovering the cursor over a node on the chart will show the details of the number of ratings for that status over the 7 days up to and including the relevant date.
In the example below, the node is showing that there were 3 ratings of Very Happy from 13th September to 19th September.
Hovering the cursor over a node on the Average trend line shows the average wellbeing score for that week, rather than the number of ratings.
Negative Status Reviews
This panel lists each negative status that has been submitted from the assessor's caseload, ordered by the most recent, so that the assessor can review them and record any action taken.
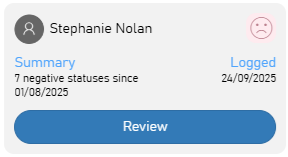
Each status shows:
-
the learner's status (Unhappy or Very Unhappy)
-
the date the status was logged
-
the total number of negative statuses the learner has submitted since the date specified in the settings
-
A Review button, which opens a Wellbeing Review for the learner
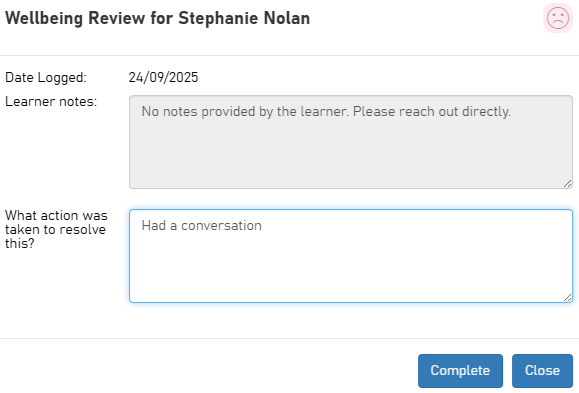
If the learner included any notes when the status was submitted, these will be displayed. The assessor can then enter the action they took to resolve this with the learner. Click Complete to submit the review.
The status will then be removed from the Negative Status Reviews panel and will be included on the Completed Wellbeing History panel instead.
Completed Wellbeing History
This panel shows negative wellbeing statuses that have been reviewed by an assessor, grouped by learners.
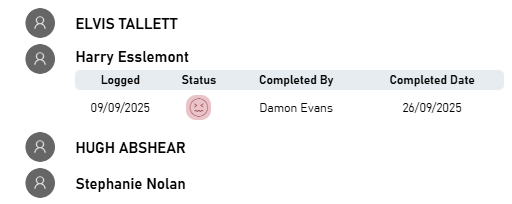
Click a learner's name to expand or collapse their history of reviewed negative statuses, and click a status to view its details.
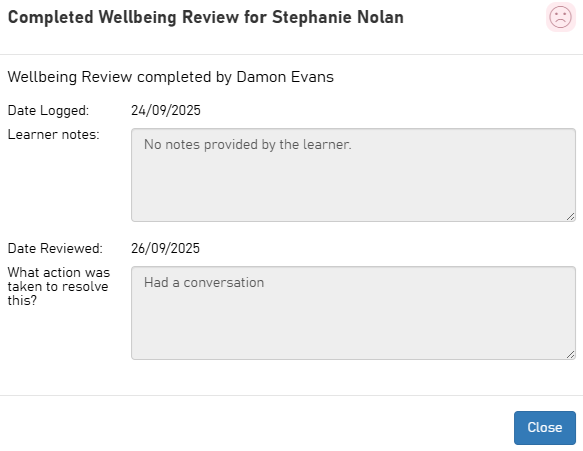
Click Close when finished.
Wellbeing Follow Up
When a learner selects a negative wellbeing status and adds a note, Maytas Hub will send a message and an email to their assessor so that they can follow up on the status.
This must first be configured:
-
Go to Settings on the sidebar.
-
Click the System Configuration button.
-
Go to Assessor Login on the left (under the Maytas Hub Online header).
-
Locate the General section on the right.
-
Tick the box for the permission TRASSESSOR link types to receive wellbeing notifications and select the trainee-assessor link types you wish to include when identifying which assessor to send the message and email to.
For example, if a learner is linked to an assessor of type A and one of type B, and only type A is enabled in the config, the type A assessor will be used.
If multiple valid assessors are identified for a learner, the assessor with the latest live link to that learner will be used.
-
Click Save.
If no valid assessors of the selected link types can be identified for a learner, or if the configuration option is not enabled, the message and email will be sent if possible to the learner's latest linked assessor of any type.
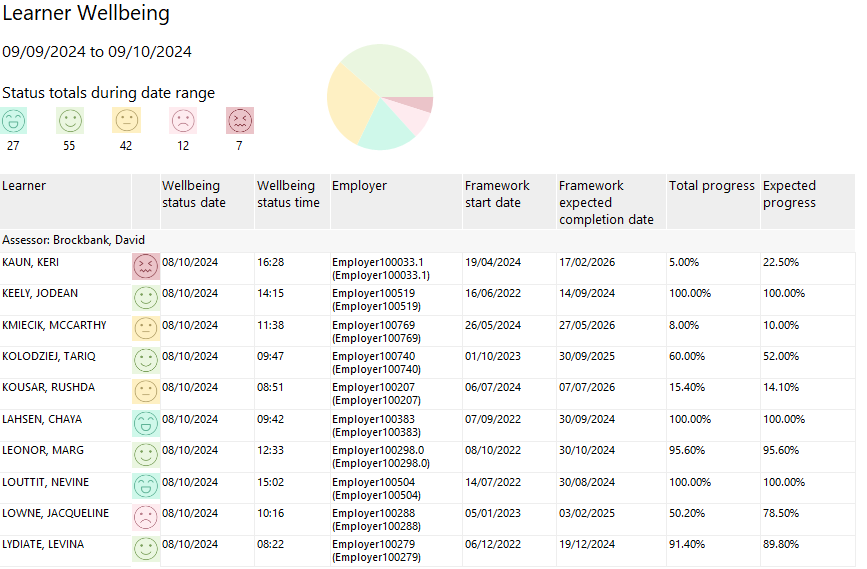
Learner Wellbeing Report
The Learner Wellbeing Report shows a summary of moods selected by learners in your caseload and your team's caseloads (if applicable) across a date range. The report also shows a list of each learner (grouped by their assessor) and their latest selected mood, and clicking a learner displays a history of all their selected moods.
The report can be accessed in Hub by going to Reports on the sidebar and selecting the Learner Wellbeing report from the dropdown list.
Parameters
-
Start / End date - The report filters by learners whose latest wellbeing status date is within this date range.
-
Assessor types - The learner-to-assessor link types to use to determine a learner's assessor.
-
Employment types - The learner-to-employer link types to user, which determines which employer (if any) shows in the Employer column.
-
Wellbeing status - Filters by the selected statuses.
-
Group by assessor - When set to Yes (the default), learners will be grouped by their assessor. When set to No, the report will list all learners from the relevant caseload(s) in a single group.
Layout
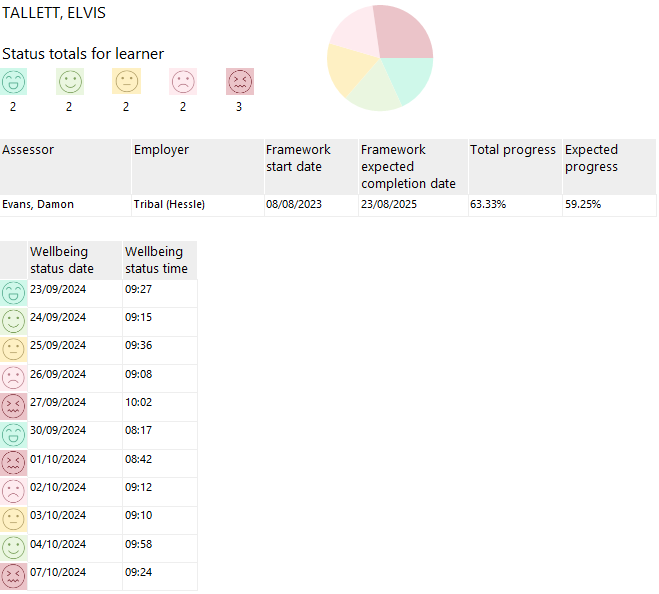
The top of the report shows a summary of the data in the date range, comprised of the number of learners for each mood (based on the learner's most recent selection in the date range) and a pie chart that shows the proportions of each mood.
The table beneath the summary lists each learner who has submitted a mood in the date range, showing their most recently submitted mood in the date range. Note that if a learner has submitted a different mood after the end of the selected date range, the most recent mood from within the date range will be shown instead.
Each row in the table also shows the date and time the mood was submitted, along with the learner's employer and an overview of key dates and progression for their framework. If a learner has multiple frameworks, their most recent one is shown.
Clicking on a learner will open a drilldown report that shows a history of the learner's submitted moods (this is not limited to the date range).