Maytas BI Setup and Release Notes
Full instructions for using Maytas BI can be found here.
Setup
The Maytas 5 upgrade MUST be performed before continuing with this setup guide, as there are database changes that are required by BI. Failure to do so may cause issues with the BI .pbix file.
If you require any assistance with setting up Maytas BI, please raise a ticket on the Self Service Portal.
Once Maytas 5 has been upgraded, the Maytas BI.pbix file must be pointed at your BI connector so that it can retrieve the required data from your Maytas database:
-
Browse to the Maytas BI folder of the release.
-
Take a copy of Maytas BI.pbix and open it in Power BI Desktop.
-
You will see a message saying that there are pending changes that haven't been applied. Ignore the message - do not apply or discard the changes.
-
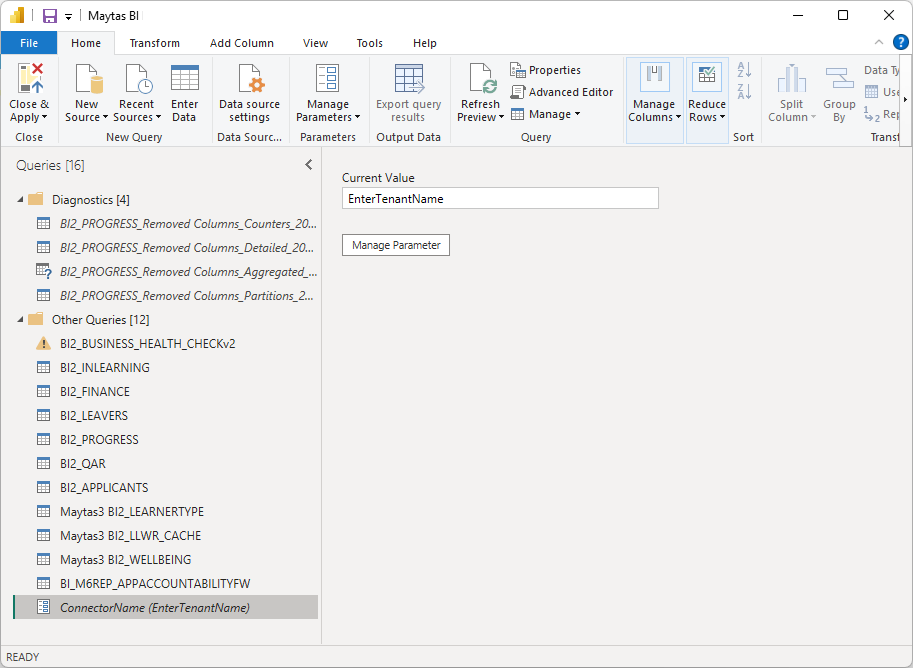
Go to Home on the toolbar and click Transform data. This will open the Power Query Editor.
-
Select ConnectorName (EnterTenantName) at the bottom left of the window.
-
In the Current Value box, delete the text EnterTenantName and enter the name of the tenant that your BI connector points to.
-
Click Close & Apply.
-
This may automatically trigger each dataset to refresh its data. If not, go to Home on the toolbar and click Refresh.
-
You may also be prompted to enter your credentials for the BI connector to connect to the tenant. Do so to continue.
-
Once all data has been refreshed, save the changes.
Maytas BI 5.31 Release Notes
Apprenticeship Accountability Framework Dashboard
The Apprenticeship Accountability Framework dashboard shows the current results for each measure from the AAF specification, along with a summary of how many measures are on track, need improvement or are at risk.
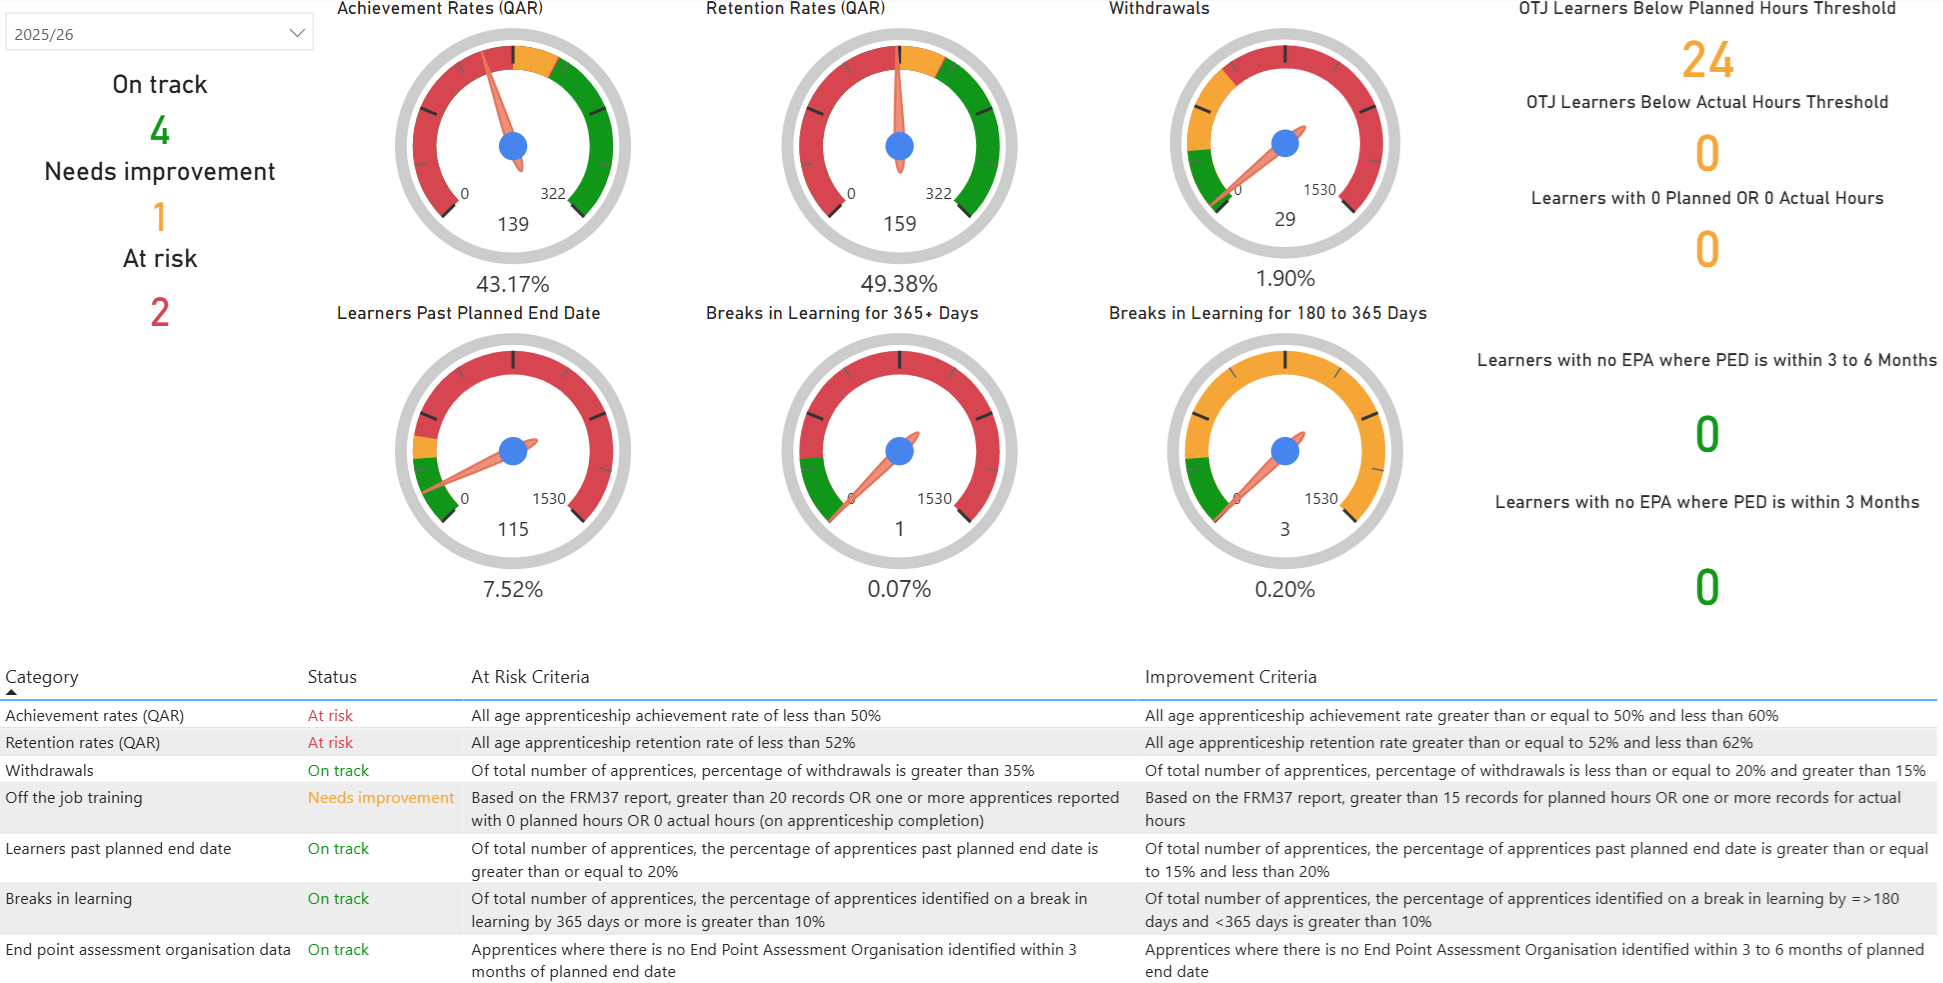
The dashboard consists of several areas:
-
The contract year selection box (top-left). This lets you choose the year to show data for, which is limited to the current year and the previous four years.
-
The totals along the left showing the number of measures which are on track (green), need improvement (amber) and at risk (red).
-
The dials, which show the percentages for six of the measures and are colour-coded based on the percentage thresholds for on track / needs improvement / at risk.
-
Measures along the right side which show a count of learners rather than a percentage. These are also colour coded as above.
-
The table at the bottom listing each of the measures, their status and the criteria for at risk and needs improvement.
Similarly to the Maytas 5 AAF report, the base set of learners used to produce the results is determined by an ILR export. However, unlike the M5 report, it is not possible to select which ILR export to use, as this would require the data for every ILR export to be downloaded.
Instead, a single ILR export is automatically selected for each year. The criteria for each year is to select the most recent ILR export for the latest available period where the export has been output to an XML file without errors.