Maytas Business Intelligence (BI)
The Maytas BI module is a collection of dashboards that present information vital to your business, so that you can see at a glance where you are achieving your goals and where your attention is needed. Each dashboard is oriented around a particular area of interest, such as applicants, progression and business-wide KPIs, including charts relevant to that area designed to provide information required on a long-term and day-to-day basis. Every dashboard can be filtered by centres and contractors, as well the ability to filter by a selection of months (e.g. year-to-date).
The pages in this section detail the standard dashboards and charts provided by Tribal in the Maytas BI module. On this page, you can click on each dashboard header to view the details for that dashboard. You can also expand each dashboard to preview the charts and their layout.
General tips and miscellaneous notes about using the BI module can be found here.
For information about purchasing the Maytas BI module, please contact your account manager.
This shows learners on applicant contractors, as well as conversions from applicants to full starters.
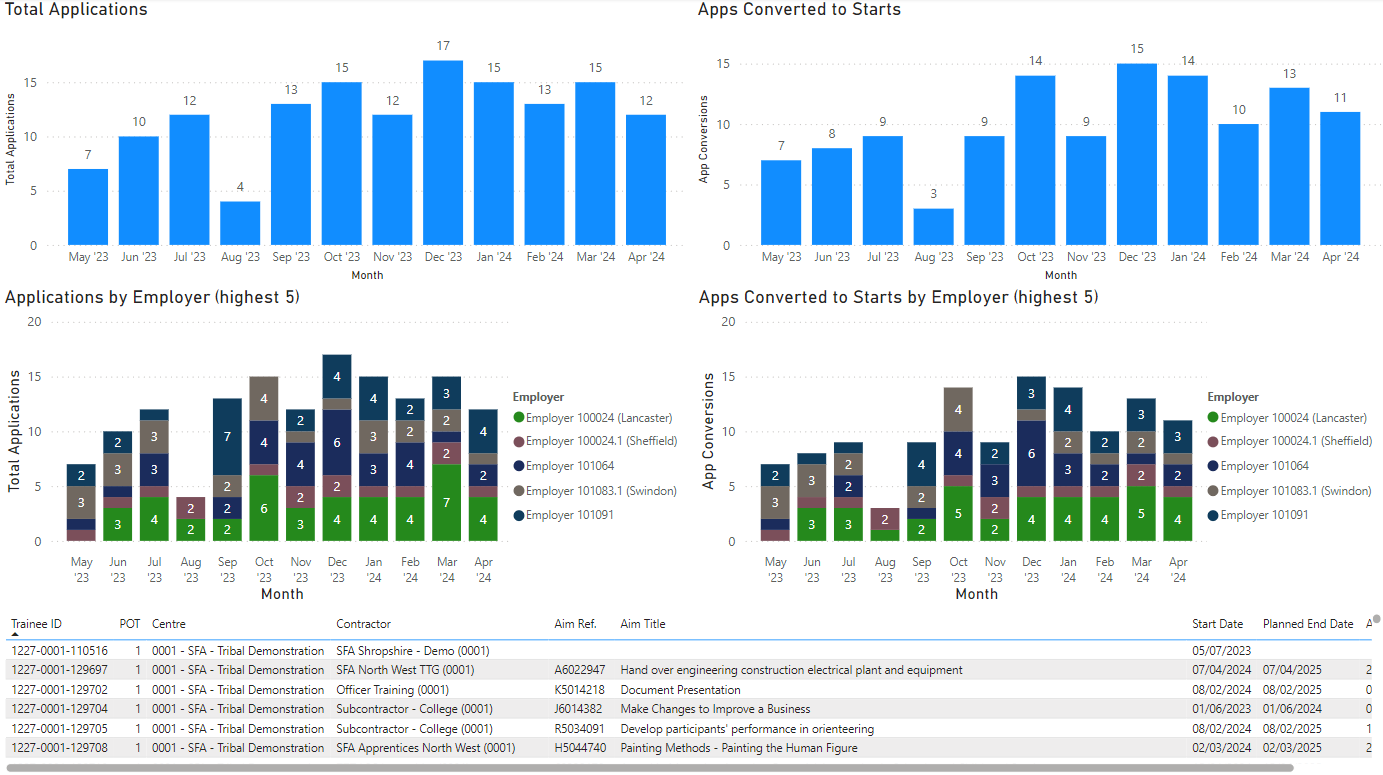
Applicants Charts
Click a chart name to go directly to its details
Applications by Employer (top 5)
This shows a summary of current figures and a comparison of target vs actual starters.
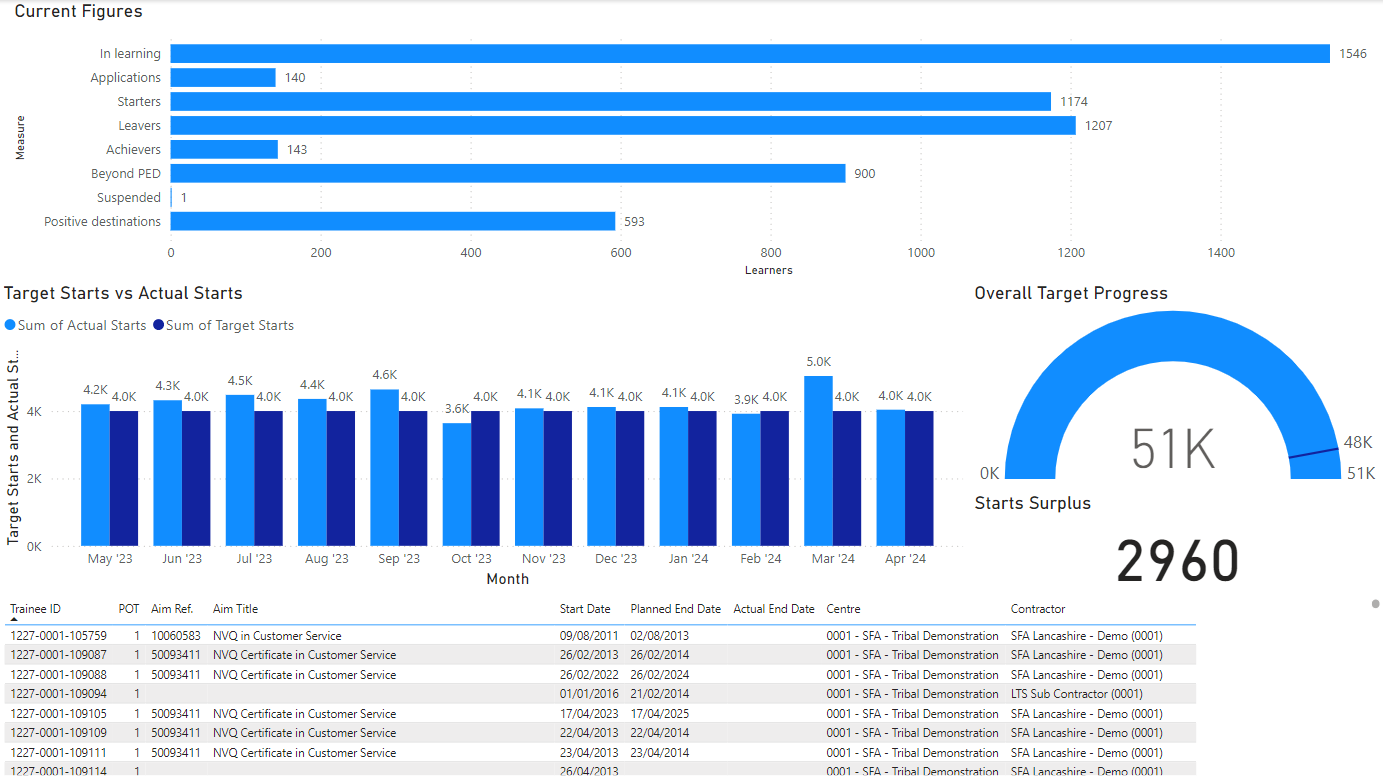
Business Health Check Charts
Click a chart name to go directly to its details
This shows the same data as the Business Health Check dashboard, presented in a different way.
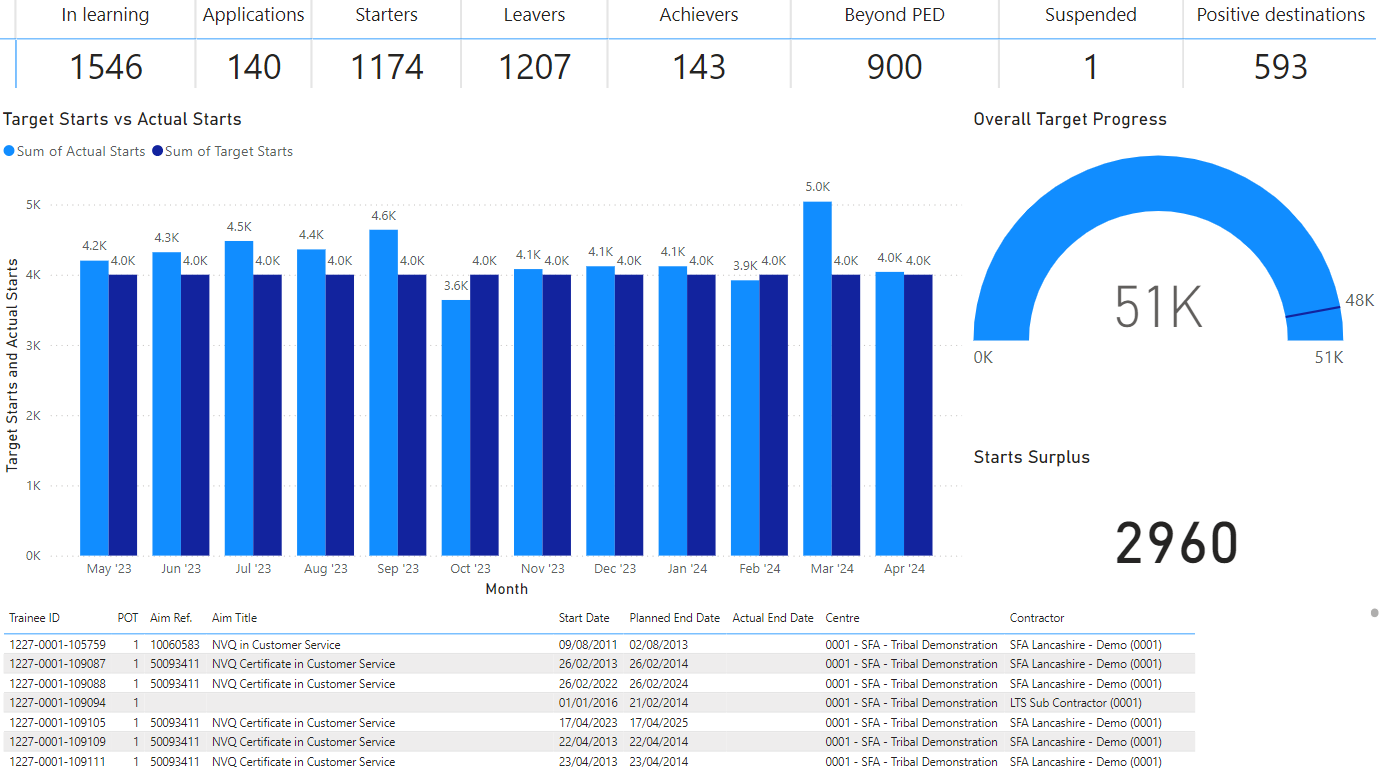
Business KPI Charts
Click a chart name to go directly to its details
This shows a variety of data relating to learners currently in learning.
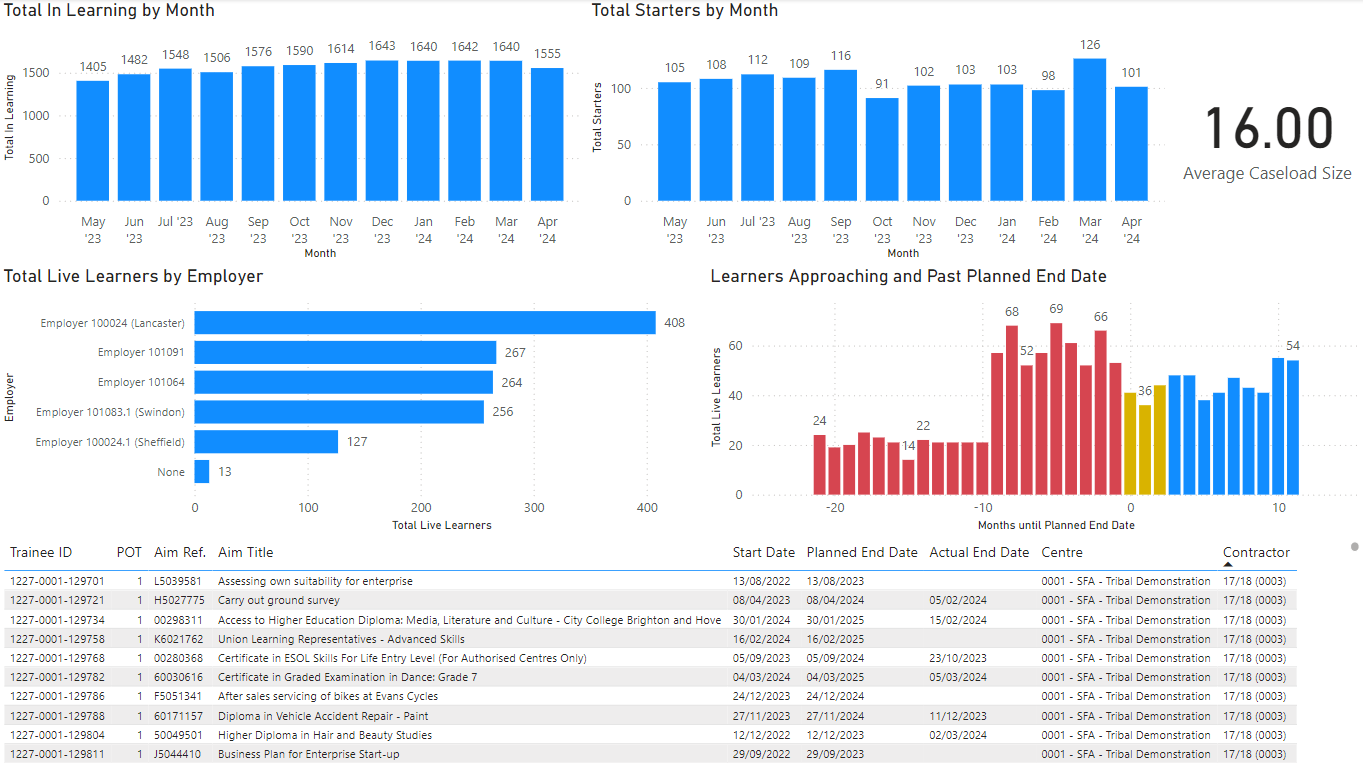
In Learning Charts
Click a chart name to go directly to its details
Total Live Learners by Employer
This shows a breakdown of leavers and learner destinations.
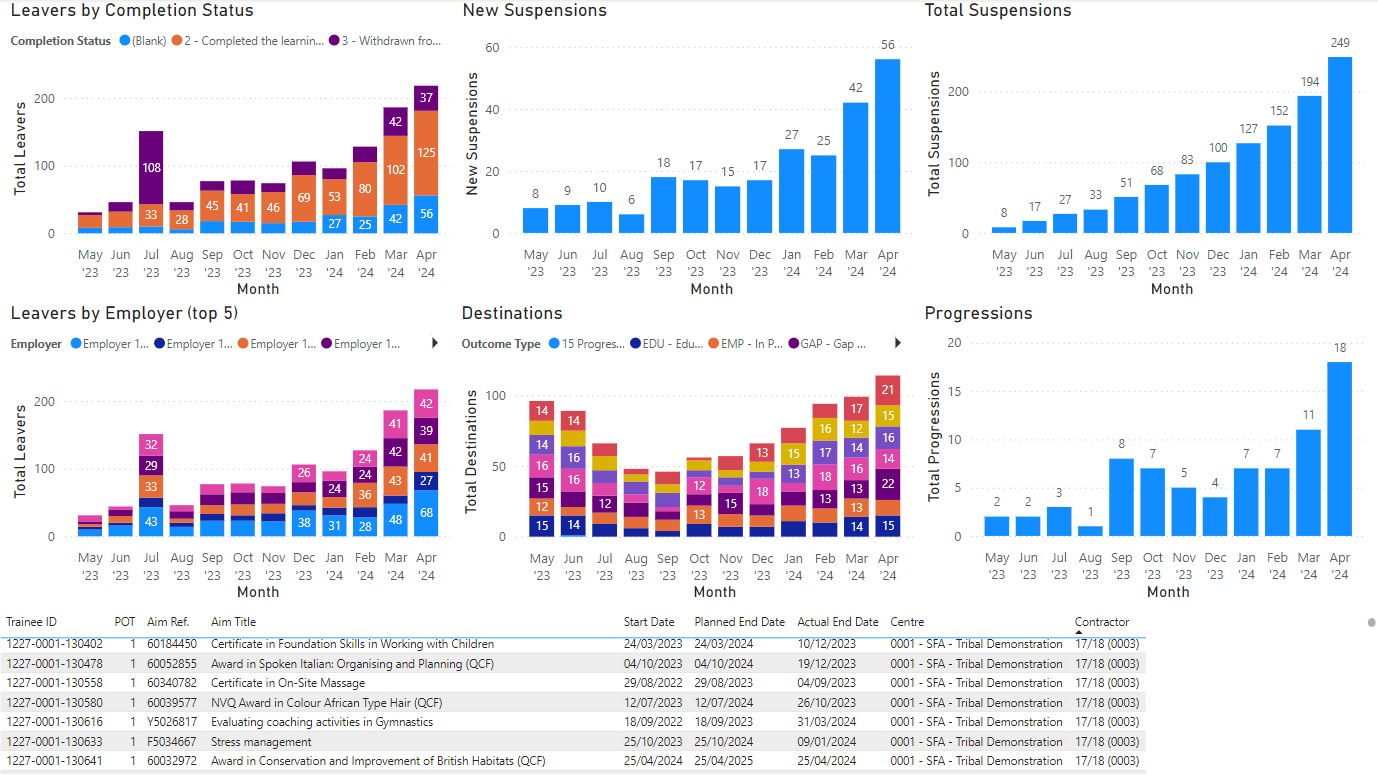
Leavers Charts
Click a chart name to go directly to its details
This shows a summary of financial figures and trends.
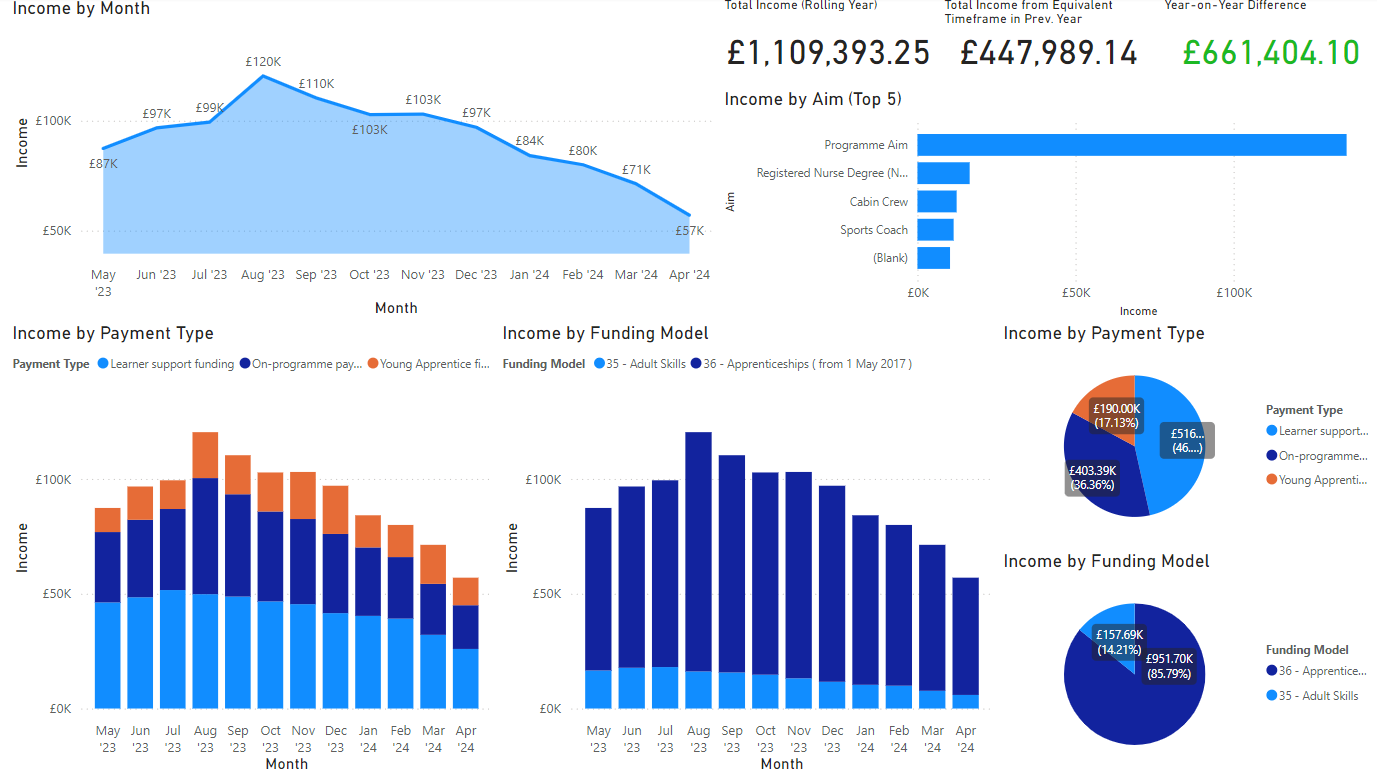
Progress Charts
Click a chart name to go directly to its details
Total Income from Equivalent Timeframe in Prev. Year
This shows a summary of visits and Maytas Hub progress.
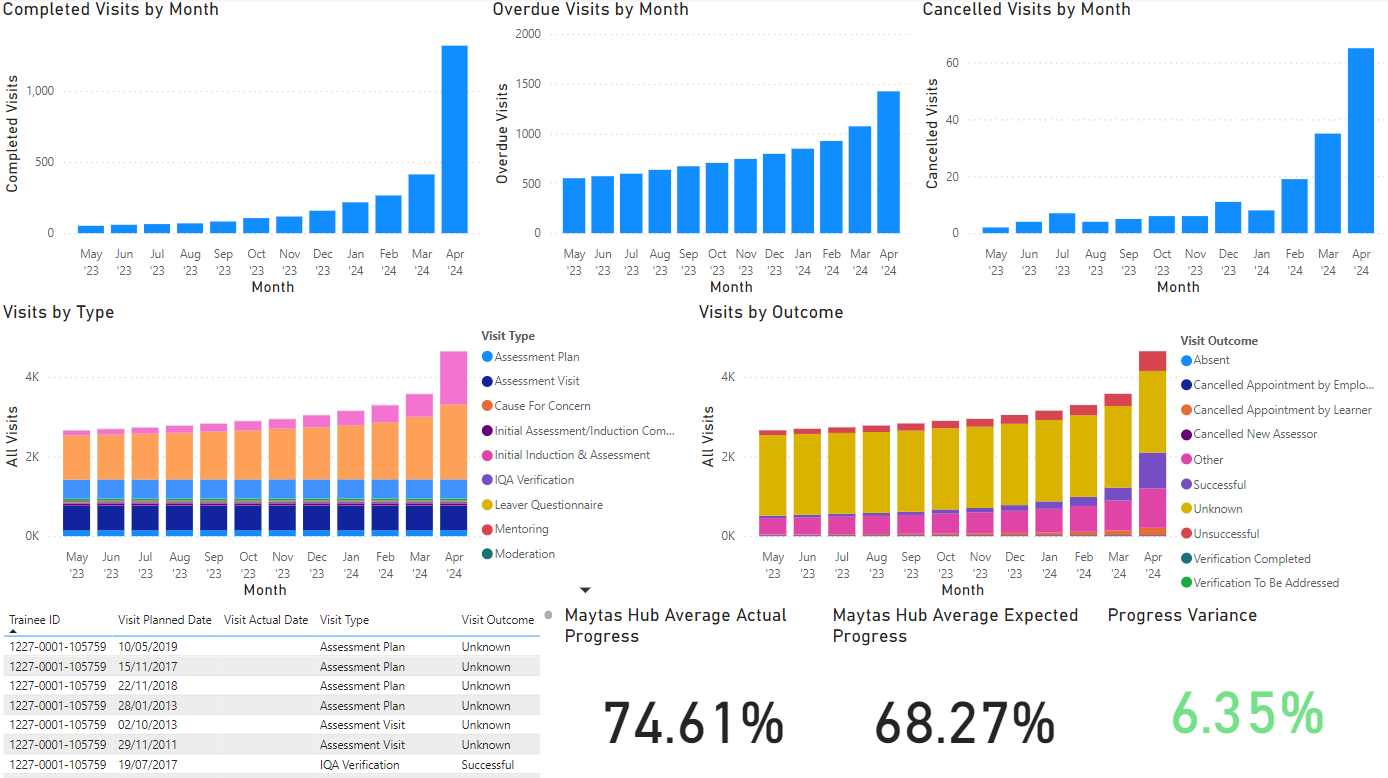
Progress Charts
Click a chart name to go directly to its details
Maytas Hub Average Actual Progress
This shows a summary of achievement rates for Apprenticeships.
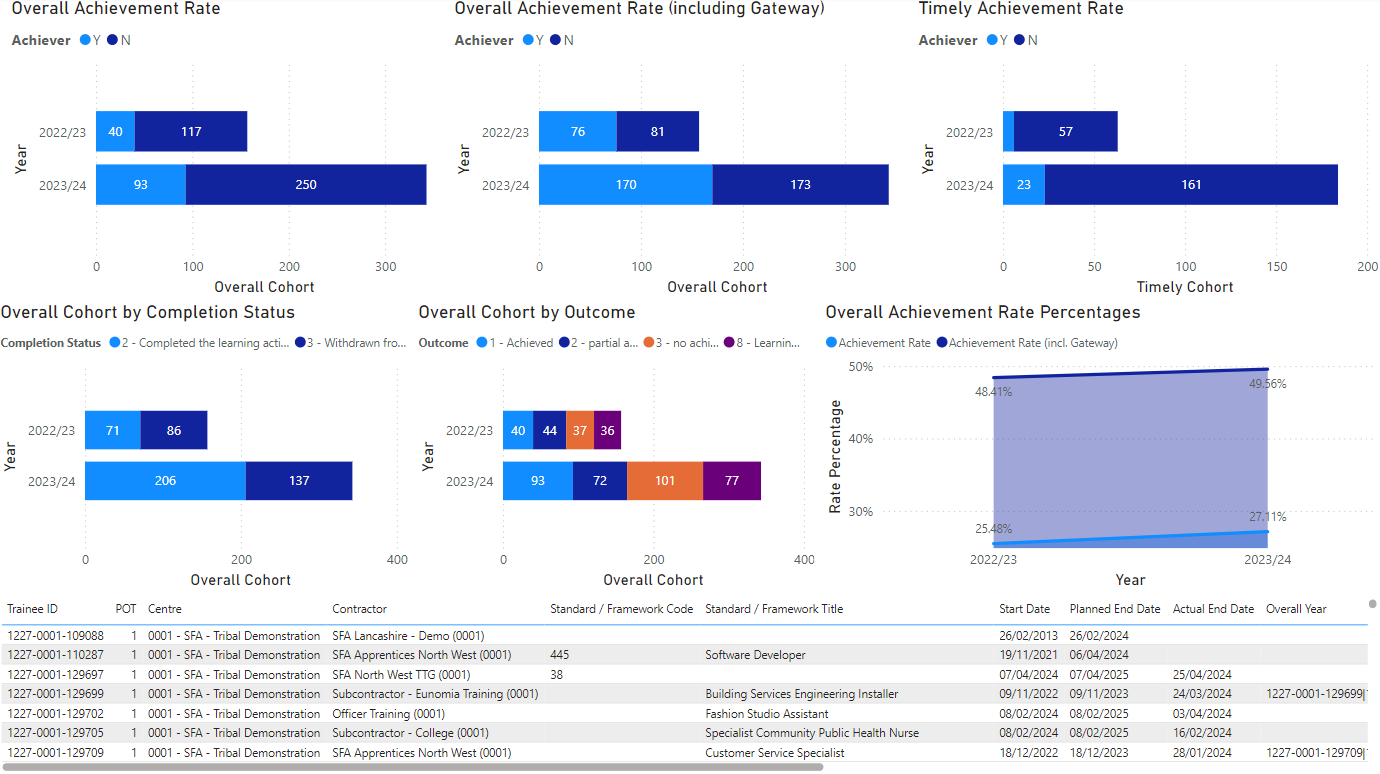
QAR Apprenticeship Charts
Click a chart name to go directly to its details
Overall Achievement Rate (including Gateway)
Overall Cohort by Completion Status
This shows a summary of achievement rates for Education & Training.
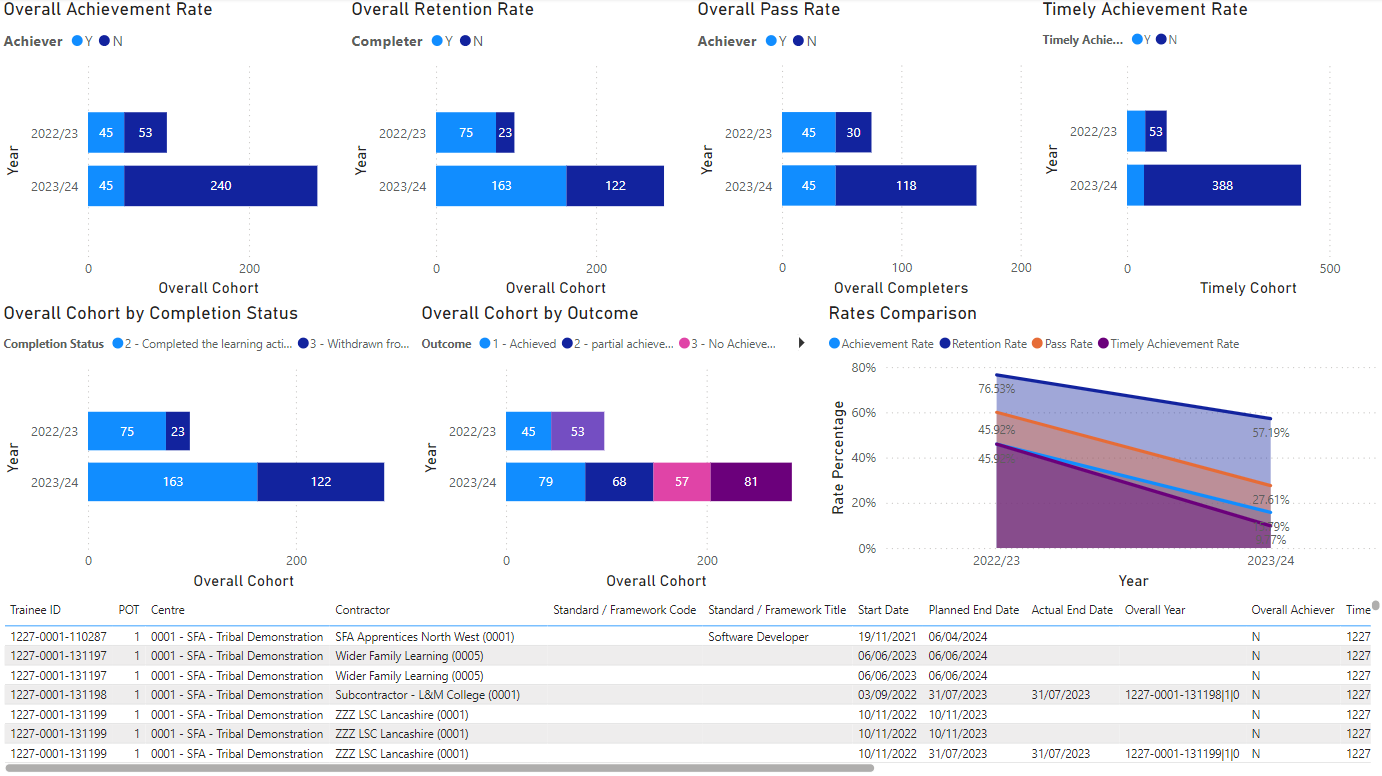
QAR Charts
Click a chart name to go directly to its details
This shows a summary of achievement rates for Traineeships.
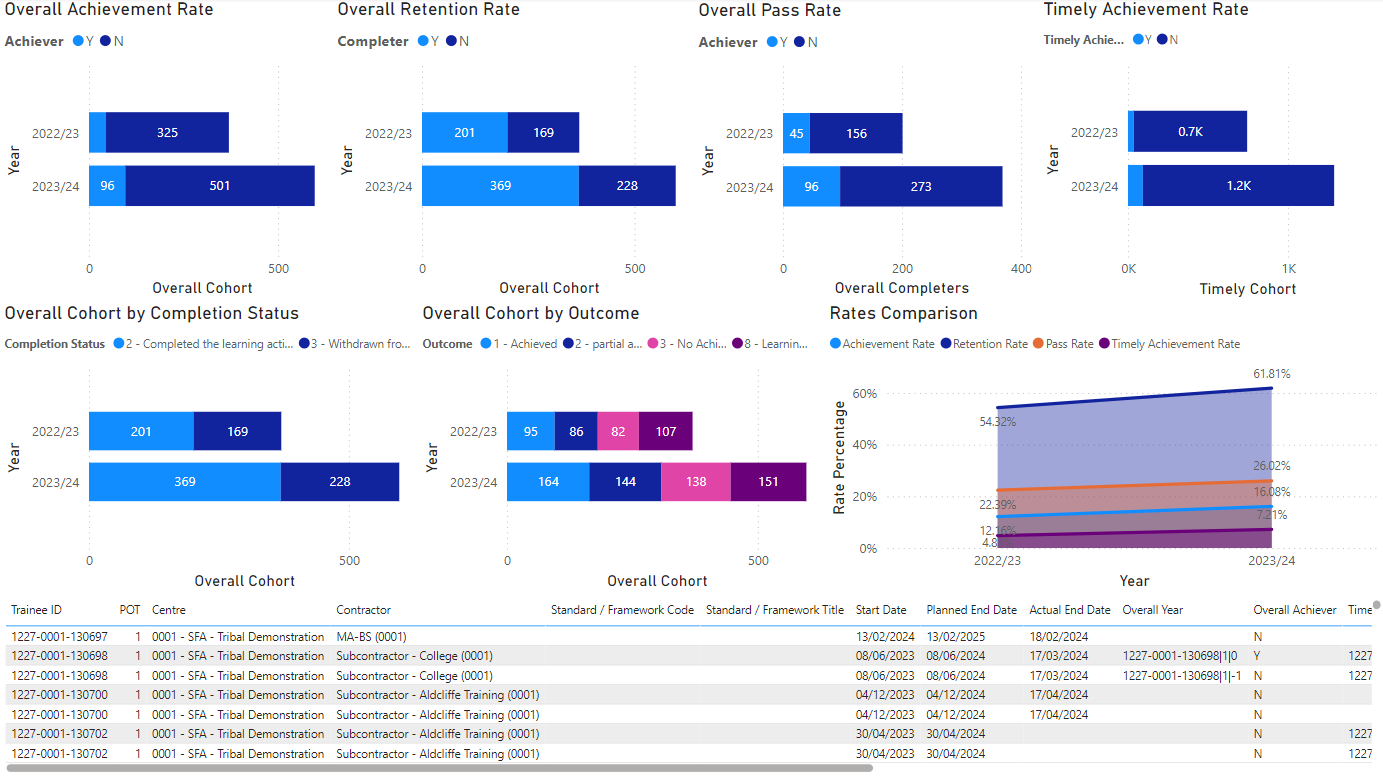
QAR Charts
Click a chart name to go directly to its details