Business Health Check
Overview
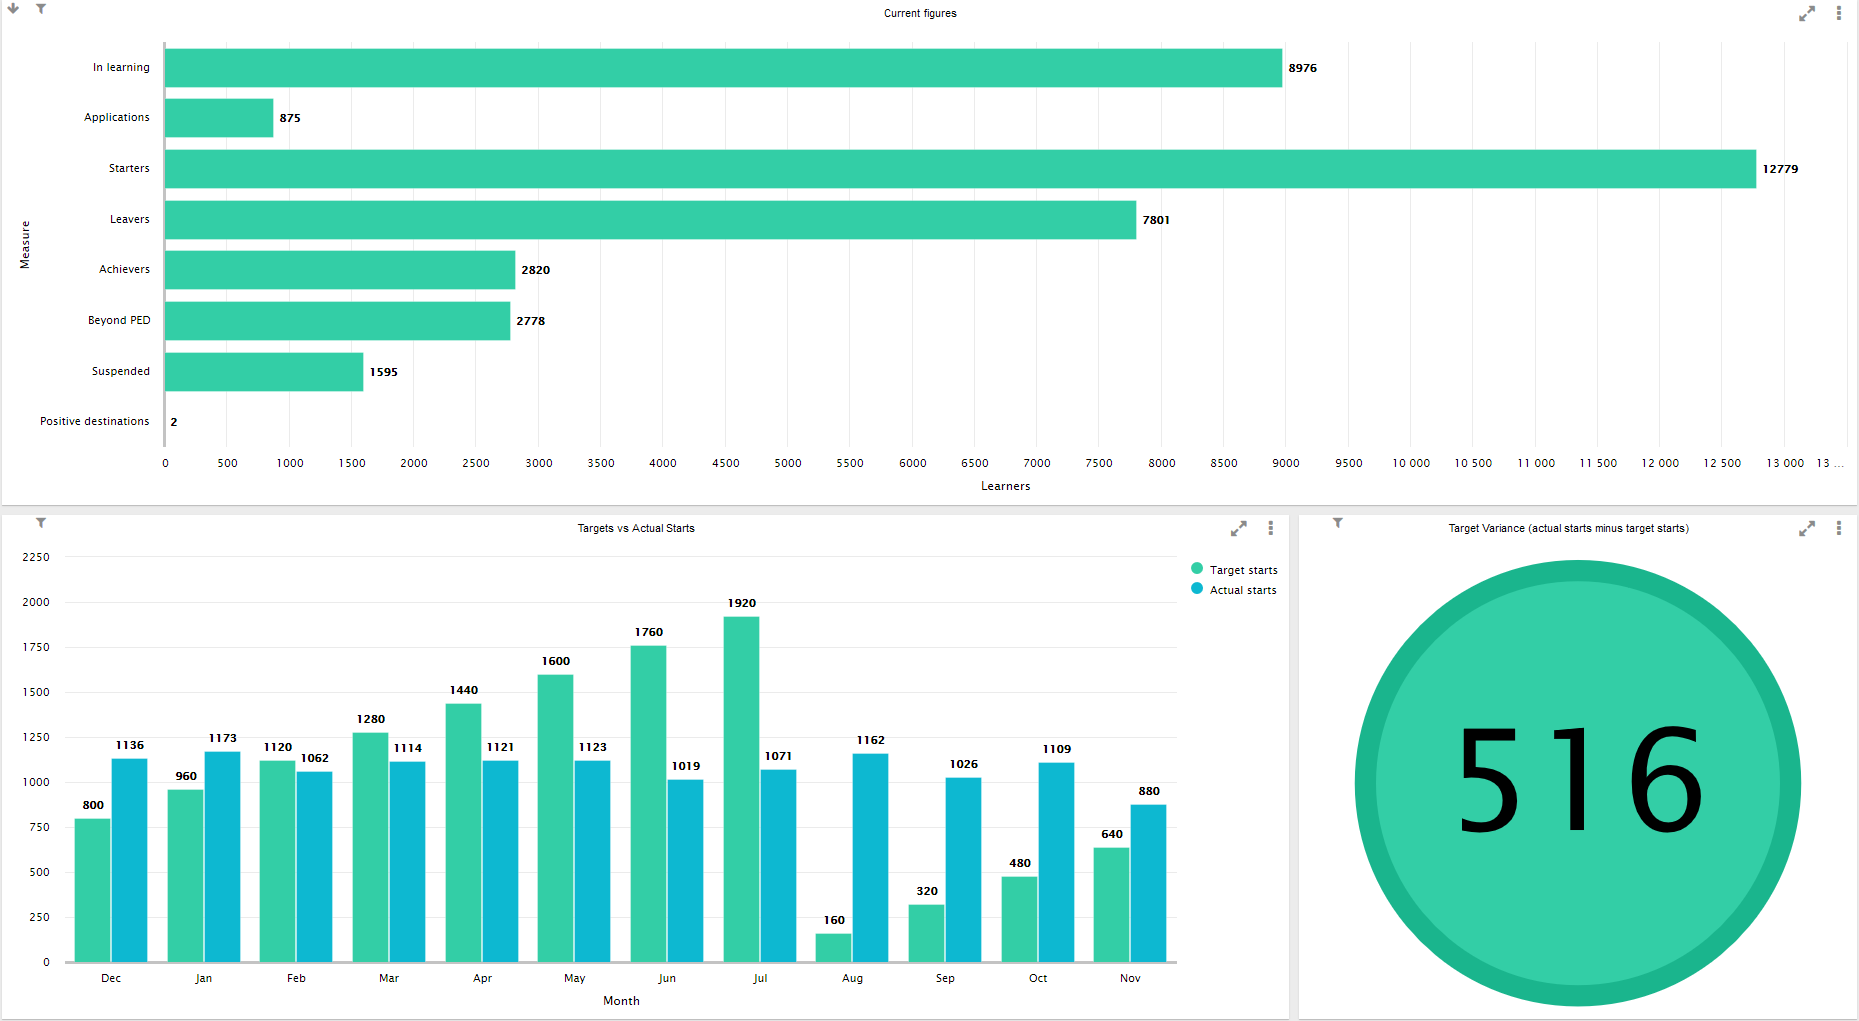
The Business Health Check dashboard shows a summary of current figures and a comparison of target vs actual starters.

Charts
Current Figures
Shows various learner counts for key measures.
Note that the Applications count only includes learners on an applicant contractor, whereas all other counts on this chart only include learners who are NOT on an applicant contractor.
- In learning - Learners currently in learning. Note that this is not a count of learners who were in learning at any point in the selected time period (year to date or rolling 12 months), but a count of learners who are currently live.
- Applications - New applicants during the selected time period.
- Starters - New starters during the selected time period.
- Leavers - Learners who ended learning during the selected time period.
-
Achievers - Learners who achieved during the selected time period.
ILR learners are counted as achievers in the month of their POT termination date and where they have a programme or main aim completion status of 2 (completed) and an outcome of 1 (achieved).
LLWR learners are counted as achievers in the month of their POT termination date and where they have a framework achievement award with an award reference of LDKKFRAM.
- Beyond PED - Learners currently in learning who have gone past their planned end date (the main aim planned end date for ILR learners and the LP77 expected end date for LLWR learners).
-
Suspended - Learners currently on a planned break or who have suspended learning.
ILR learners are counted as being on a planned break if their programme aim completion status is 6 (or if the main aim completion status is 6 if there is no programme aim).
LLWR learners are counted as having suspended learning if any of their activities has a completion status of 5.
-
Positive destinations - ILR learners who have a destination record with a collection date after their POT termination date and an outcome type of Education, In Paid Employment, Gap Year or Voluntary Work.
Note that LP42 Destination was removed from the LLWR in 2019, and so it cannot be used for determining destinations for LLWR learners.
Targets vs Actual Starts
Shows the number of learners who started each month in the selected time period compared to the target number of starters. The targets are set at contractor level and are taken from the BI_STARTTARGETS table, which has a row for every contractor, year and month. These can be entered using the Global Updater.
Target Variance (actual starts minus target starts)
This shows the overall difference across the selected time period between actual starts and target starts. A positive number shows green and indicates the surplus starts, whereas a negative number shows red and indicates the shortfall of starts.