Funded / Unfunded Learners
The Funded/Unfunded Learners report shows the trend of funded and unfunded learners over a period of time.
Parameters
- Exclude obsolete assessors - When set to Yes, this will remove obsolete assessors from the filter parameters (if assessor is chosen as a grouping). Also, if grouped by assessor, it will group learners with obsolete assessors under a blank grouping.
- Show forecasting - When set to No (default), only actual termination dates are used (i.e. learners who are currently in learning will be shown as in learning in future months on the report). When set to Yes, the report will assume that learners who are currently in learning and funded will end learning (and achieve) on their planned end date. Learners who are currently in learning and unfunded will be forecasted to end learning in the current month.
- Filter / grouping 1, 2 and 3 – The filter / grouping parameters have a dual role. When a category is selected from the list, the report both groups and filters on this. The default values are Centre, Contractor and Scheme.
- Filter data 1, 2 and 3 – While the above parameters determine the category to filter by, these corresponding parameters choose the exact data to filter by (e.g. assessors, employers, etc).
- Period start / end date – These two dates determine the period of time to report on. The default dates are the start and end dates of the current contract year.
- Exclude suspended learners - This will include suspended learners when set to No (the default) and exclude them when set to Yes.
- Assessor types - The assessor types used to determine which assessor results are counted against when the report is grouped by assessor.
- Employment types - The employment types used to determine which employer results are counted against when the report is grouped by employer.
- Ready to run - Set this to Yes when you have set the other parameters as required.
Layout
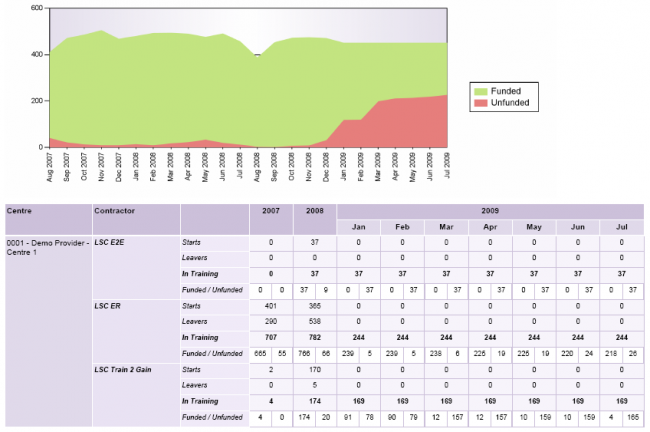
The report is split into a graph and a table. The graph is a stacked area chart showing the number of learners in training over time, where the green area represents funded learners and the red area represents unfunded learners. As the two areas are stacked, the top line of the green area represents the total number of learners in training.
A number of observations can be made with the graph. These are some common examples:
- A rise in the green area while the red area stays the same suggests an intake of new learners (usually around the start of a contract year).
- A drop in the green area while the red area stays the same suggests learners are leaving on or before their funding expiry date, while new learners are not being taken on (usually around the end of a contract year).
- A rise in the red area while the green area stays the same suggests learners are continuing past their funding expiry date.
- A drop in both areas suggests that unfunded learners are leaving.
The graph also makes future projections if your Period end date parameter is a future date. This works on the assumption that learners will leave on their funding expiry date, and does not make predictions for new starters. It should therefore be treated only as a rough indication.
The table shows the data that the graph is based on. The groupings chosen from the parameters are shown on the left, followed by a column which describes the type of learner being counted (starters, leavers, in-training, funded or unfunded).
The learner counts are shown chronologically by month, although this can be collapsed to show the counts for each year by clicking the button next to the year. The count types for each month are as follows:
- Starts – The number of learners who started in the month.
- Leavers – The number of learners who ended learning in the month (this does not take into account the reason for leaving, and so it includes achievers, partial achievers and early leavers).
- Achievers - The number of learners who achieved their main aim or framework during the month.
- In Training – The number of learners who were in training at any point during the month.
- Funded – The number of learners who were in training and funded at any point during the month.
- Unfunded – The number of learners who were in training and unfunded for the whole month. If a learner is funded at any point in the month, they will appear in the Funded count instead.
The In Training value is the sum of the Funded and Unfunded values (since all learners are either funded or unfunded). Logically, the In Training value for the following month is the In Training value for the current month, minus the number of leavers for the current month, plus the number of starters in the following month. This is demonstrated in the example below:
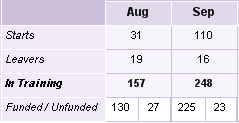
157 learners in training in August
- 19 leavers in August
+ 110 starters in September
= 248 learners in training in September
The leavers in August are still included in the in-training count for August, as the leavers were in-training at some point during the month. Therefore they are taken away from the in-training value in the following month.