Sales Pipeline
The Sales Pipeline and Contact Management module allows you to plan targets, keep track of your sales opportunities and record contact with learners, assessors and employers. These features can be found on the Contact & Sales panel of the ribbon, which is on the Home tab.

The Sales Pipeline has two modes:
- My Pipeline – This shows your own sales pipeline.
- System Pipeline – This shows the system-wide pipeline (i.e. for all users).
Both modes have the common features detailed below, the difference being that My Pipeline will only show your own opportunities.
Overview

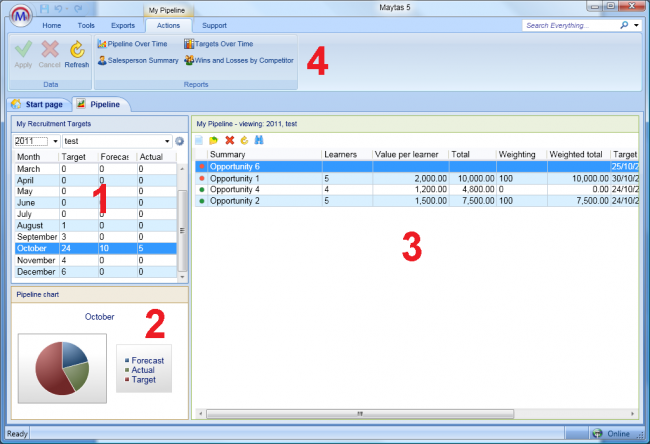
1. My Recruitment Targets
This shows your sales target, forecast and actual values for each month. The two dropdown boxes at the top let you choose which year to view and which sales grouping to filter by (selecting the <not grouped> option will show all data). The target, forecast and actual figures are entered or calculated as follows:
- Target - The target number of learners in sales opportunities which were won during the month. This can be entered directly into each month.
- Forecast - The number of learners in sales opportunities which are / were planned to close during the month (regardless of whether or not they have closed).
- Actual - The actual number of learners in sales opportunities which were won during the month. A sales item is considered to be won when it has an actual close date and the percentage success weighting is 100% (see section 2 for more details).
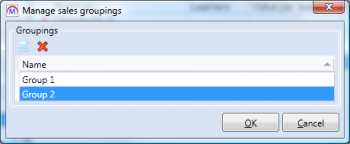
Sales groupings can also be managed here by clicking the  button next to the dropdown boxes:

Click the  button to add a new grouping. You can then click the new row and enter a name for the grouping. To delete a grouping, select it and click the
  button. Each sales opportunity can be assigned to a grouping to make them simpler to organise.
On the system pipeline, the  button (also next to the dropdown boxes) will automatically calculate the targets for the selected year and grouping. This is based on the summary of targets for individual salespersons.
2. Pipeline Chart
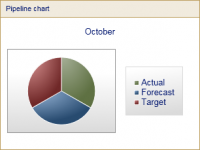
When a month is selected from the table above, the target, forecast and actual figures are presented as pie chart below. The example below shows a target of 9, a forecast of 6 and an actual of 3 for October:

The pie chart is layered rather than proportional. In other words, the red remaining target value always forms the full bottom layer (9 in this case), with the blue remaining forecast forming the middle layer (6, meaning it covers two-thirds of the target) and the green actual forming the top layer (3, meaning it covers one-third of the target and half the forecast).
If the forecast is greater than or equal to the target value, no red target area will be shown as the forecast will cover it. Similarly, if the actual is greater than or equal to the forecast, no blue forecast area will be shown.
3. My Pipeline
This lists the sales opportunities for the year and sales group selected from the dropdown boxes under My Recruitment Targets (on the left of the screen).

Each opportunity shows the following details:
- Traffic light – This can either be red, meaning the opportunity is still open, or green, meaning the opportunity has been closed.
- Summary – The name or summary of the opportunity.
- Learners – The number of learners associated with the opportunity.
- Value per learner – The money which each learner on the opportunity will generate.
- Total – The value per learner multiplied by the number of learners, showing the total value of the opportunity.
- Weighting – The percentage likelihood of winning the opportunity.
- Weighted total – The total value of the opportunity multiplied by the percentage weighting.
- Target date – The date by which the opportunity should be closed.
- Actual date – The date on which the opportunity was actually closed.
- Status – The current status of the opportunity.
- Employer – This shows the employer associated with the opportunity (if there is one).
The buttons above the table allow a range of functions:
 - Creates a new opportunity.
 - Opens the currently selected opportunity.
 - Deletes the currently selected opportunity.
 - Refreshes the list of opportunities.
 - Lets you filter opportunities with a search term (based on the Summary field).
 - Lets you choose which columns to show on the grid. Tick or un-tick the column boxes as required. You can also drag and drop the columns to re-order them.
4. Reports
A set of Sales Pipeline reports can be run directly from the ribbon. Please see the reports library page for more information on the reports.
Create a New Opportunity
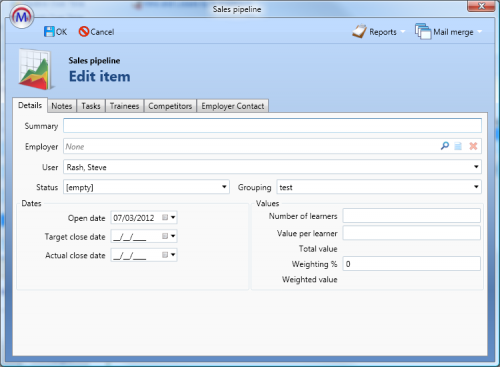
To create a new sales opportunity, click the  button above the sales pipeline table.

There are five tabs for each opportunity:
Details
This shows the basic details of the opportunity.
- Summary – The name or a brief summary of the opportunity.
- Employer – If the opportunity is associated with a specific employer, the employer can be attached to the opportunity here. To search for and attach an existing employer, click the
 button. To add a new employer and attach it, click the
  button to open the Add Employer wizard. You can also remove an employer which has already been attached to an opportunity by clicking the
  button.
 - Status – The current status of the opportunity. The options in this list can be configured as lookups. Each option will set the weighting % to a pre-determined value (e.g. the default options of Won and Lost will set the weighting % to 100 and 0 respectively). However, a system config is available to specify which options should set which values, if you wish to change them.
- Grouping – Allows a sales grouping to be assigned to the opportunity.
- Open date – The date the opportunity was opened.
- Target close date – The intended target date to close the opportunity.
- Actual close date – The date the opportunity was actually closed.
- Number of learners – The number of learners that would be recruited if the opportunity was won.
- Value per learner – The money which will be generated from each learner in the opportunity.
- Total value – This is calculated as the number of learners multiplied by the value per learner.
- Weighting % – The percentage likelihood of winning the opportunity. This is set automatically based on the status that is selected, but it can also be manually edited.
- Weighted value – This is calculated as the total value multiplied by the weighting % (e.g. a total value of £10,000 and a weighting % of 50% would have a weighted value of £5,000).
Notes
This allows you to add notes to the sales opportunity. To add a note, click the  button. You can then enter the date the note was added and the note itself. Click OK when finished to save the note.
Tasks
This lets you create tasks relevant to the opportunity. To add a task, click the  button. You can then enter the task summary, due date and description. Tasks will also appear on the Maytas 5 start page on the left (click Tasks at the bottom-left. You may also need to click the
  button to alter the task filters for particular tasks to show).
Trainees
This lets you attach specific learners to the opportunity. To add a learner, click the  button. You can then either click Add existing to search for and add an existing learner, or click Create new to add a new learner.
Competitors
This lets you add and attach competing businesses to the opportunity. To add a competitor, click the  button. If you have already added competitors, you can select an existing one from the Competitor dropdown box. Otherwise simply enter into the Competitor box to add a new one. The Status box lets you specify whether the opportunity has been lost to or won against the competitor. If the opportunity is still in progress, this can be left blank. At the bottom of the window you can enter notes about the competitor for the opportunity.
Employer Contact
This lets you maintain a comprehensive log of all contact with the employer. Please note that an employer must be attached on the Details tab of the opportunity for the Employer Contact tab to work.
Please see the Contact Log page for information on using this tab.
Lock Down Sales Targets
Sales managers can be given a permission which enables them to lock down sales targets. This prevents other salespersons from being able to alter their targets. To enable the permission:
- Go to Tools | Edit Permissions.
- Select the relevant user or group.
- Go to the Commands tab.
- Expand the Contact module section.
- Set the Edit Other Users Pipeline permission to Visible.
- Click Apply.
The permission will be applied the next time the user restarts Maytas. To lock targets:
- Go to Home | My Pipeline.
- You will now see a User dropdown box on the ribbon. Select the user for whom you wish to lock targets.
- Right-click the target on the left of the screen and select Lock target. This will lock the target for the selected year and grouping. You can also lock targets for all months by right-clicking the Target header and selecting Lock All In View.
- Click Apply.
The targets will be locked for the relevant user the next time they restart Maytas.